

Copyrights: Hafiz Muhammad Shoaib Zahid, Tanveer Ahmed Khan, Muhammad Ijaz-ul-Haq, Humayun Riaz, Syed Atif Raza, Zia Mohy-ud-din Khan, 2017. License: This work is licensed under a Creative Commons Attribution 4.0 International License.
Abstract
Introduction: The aim of the current study was to determine the angiogenic/anti-angiogenic effect of Naproxen Sodium and to determine the effective dose of NapS for angiogenesis.
Method: Fertilized eggs (5days old) of chicken were acquired from a local hatchery. They were incubated at 37oC with humidity of 55-60%. Then, on the 5th day of incubation, a window about 2cm in diameter was created by removing the shell and then the inner shell membrane. It was done under aseptic environment. There were 5 groups designed. Group A was kept as control and was given 0.2ml PBS, group B, C, D, and E were given 0.1ml of 0.086g/100μl, 0.042g/100μl, 0.021g/100μl and 0.011g/100μl of Naproxen Sodium (NapS) respectively. On the sixth day, prepared concentrations of NapS were administered and eggs were again sealed with paraffin film under aseptic conditions. These were placed back in the incubator for next 24 hours. After 24 hours, eggs were taken out from the incubator and images of all groups were made using a DSL camera. The development of blood vessels and other features were observed using Adobe Photoshop version 7.0, then these images were transferred to scan probing image processing (SPIP) software 6.6.2. The diameters of different blood vessels were measured by using expert design software. The parameters include: the diameter and branching system of blood vessels measured as per mm, and categories of blood vessels; i.e., primary, secondary and tertiary blood vessels. Data were analyzed on SPSS statistical software version 22.0 using ANOVA. Dunnett’s test was applied considering P < 0.05 as significant.
Result: Application of Naproxen sodium on chorioallantoic membrane of day six of incubation showed angiogenic effects in high concentration and anti-angiogenic effect in low concentration. Outcomes indicated significant changes in CAM’s design, thinning of primary, secondary and tertiary blood vessels, reduction in surface roughness parameters, and decrease in Abbott curve. Conclusion: The substantial quantities of Naproxen sodium use locally may exhibit anti-angiogenic activity in the same manner those seen in vitro and explain its clinical efficacy.
Introduction
The development of new blood vessels from pre-existing capillaries is termed as angiogenesis Griffioen and Molema, 2000. This term angiogenesis (AG) was used in 1935 to define the development of new blood vessels in the placenta Hertig, 1935. All cells and tissues survival are solely dependent on AG. Therefore, AG is extremely meaningful to different physiological functions like wound healing, menstruation, development of embryo and normal tissue growth Griffioen and Molema, 2000. Physiologic AG involves many different pro- and anti-angiogenic stimuli including various environmental and growth factors Griffioen and Molema, 2000. The AG switch is also observed as a distinct stage of cancer development, that occurs at any phase of tumor development and its micro-environment Bergers and Benjamin, 2003. The use of anti-AG drugs for the management of AG established conditions have presented a lot of therapeutic potential. Numerous anti-AG medications are presently under development, involved in clinical trials or are being used in the treatment of AG complaints, mostly cancer Abdollahi and Folkman, 2010. CAM model is used in the experiments in this study in order to test anti-angiogenic agents alone and in combination Tufan and Satiroglu-Tufan, 2005. This model delivers a usual, in vivo setting of angiogenic blood vessels with all the multifaceted swarm communications on which angiogenic combinations can be verified Tufan and Satiroglu-Tufan, 2005.
Naproxen sodium is a non-steroidal anti-inflammatory drug (NSAID). It functions by decreasing hormones that provoke agony and soreness in the body. The aim of current research was to determine the angiogenic/anti-angiogenic effect of NapS and to determine the effective dose of NapS for angiogenesis.
Materials - Methods
Materials and Chemicals
This study is based on the investigation of naproxen sodium. Naproxen sodium is purchased from Sigma-Aldrich (MO, Louis St, CA). Visualization of blood vessels are achieved through DSLR Camera. 0.9% NaCl solution, which is purchased from Searl Pakistan (Pvt.) Limited, is used as a solvent to make dilutions for drug or alone as a control. Injections into the CAM’s vasculature are achieved using a Microliter™ syringes fortified with 33-G metal (N) needles.
Fertilized eggs (5 days old) of chicken were purchased from a local hatchery. They were incubated at 37°C with humidity of 55-60%. On the day five of incubation, an opening about 2cm in diameter was produced by eliminating the shell and then the innermost shell membrane. It was done under aseptic conditions. Approximately 4-5ml of albumin was detached and opening was airtight with paraffin film tape and was positioned back in the incubator.
There were 5 groups designed. Group A was kept as control and was given 0.2ml phosphate buffer solution (PBS), group B, C, D, and E were given 0.1ml of 0.086g/100µl (220 mg which is least effective dose in humans), 0.042 g/100µl, 0.021 g/100µl and 0.011 g/100µl of Naproxen Sodium (NapS), respectively. At that point, pH of every one of these arrangements was checked with a pH meter and was acclimated to 6-7.4. Keeping in mind the end goal to decline the danger of tainting, all the readied weakenings were separated through 0.2µm syringe channels. On the 6th day, the readied centralizations of NapS were directed and eggs were again fixed with paraffin film under aseptic conditions. These were set back in the hatchery for next 24 hours. Following 24 hours, eggs were taken out of hatchery and pictures of all groups i.e. control and also those treated with various convergences of NapS were made utilizing a DSL camera. The improvement of veins and different elements were watched utilizing Adobe Photoshop adaptation 7.0, then, these pictures were exchanged to filter testing picture handling programming SPIP 6.6.2. Individual x, y and z measurements of every picture were stacked to decide diverse parameters to evaluate angiogenesis. The widths of different veins were measured by utilizing adjustment and estimation command.
Image-Processing Quantification (IPQ) Method
IPQ is executed on images obtain from the DSL cameras using a macro written for SPIP (version 6.6.2) and existing plug-ins.
The parameters reported describing the degree of inhibition of the naturally developing CAM include the diameter and branching system of blood vessels measured as per mm, and categories of blood vessels; i.e., primary, secondary and tertiary blood vessels.
Statistical Analysis
Data was assessed on SPSS statistical software version 22.0 using one way ANOVA. Dunnett’s Post Hoc test was applied considering P < 0.05 as significant.
Results
Qualitative Analysis
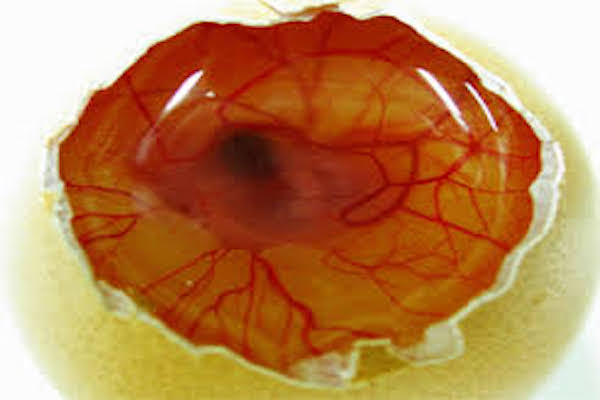
The inhibition of the physiologically-developing CAM is examined with Naproxen sodium (NapS). Exposure of the CAM with anti-AG compounds during the developmental phase characterized by exponential vascular growth prevents the regular growth of capillaries and vessels and directs the anti-angiogenic properties of the agents applied. The effects of this drug are visualized in Figure 1 . It shows that NapS is angiogenic at higher concentration and anti-angiogenic at low concentrations.

Quantitative Analysis
Quantitative analysis was done under three heads namely imaging studies, roughness analysis and diameter of blood vessels. These are discussed as below.
Imaging studies
The NapS was applied on CAM and images were captured at regular time intervals. The images captured were then analyzed with the software. These were transformed into three dimensional views of 45o as showed in Figure 2 .

Roughness analysis
There are no worldwide gauges for roughness investigation in light of surface pictures yet, however the actualized calculations are in assertion suggestions from driving specialists and a large portion of the definitions are regular augmentations of the ISO norms for surface profiles. With respect to all other expository outcomes the roughness parameters are composed of records, which can be transported in by worksheet suites and utilized for factual purposes. We also performed this parameter to check the roughness of images. Roughness of control and treated groups is given in Table 1 .

For more accuracy, the control group revealed more roughness values than treated CAM. It indicates that surface roughness of treated CAMs was significantly less than control CAMs. The Abbott curve, a graphical representation of roughness, was also performed to calculate even slight alterations in the blood vessels heights on the CAM’s surface. The heights of the Abbott curve for control and treated CAMs were observed as showed in Figure 3 .

Diameter of Blood Vessels
The captured images were evaluated with the software to determine the vessel diameters. Different segments in a selected area for measurement were identified. The respective diameters of each vessel portion located in different segments were identified using the software. Utilizing this procedure, the diameter of a specific vessel was determined automatically at each time point for the respective drug concentration. The distribution of vessel diameter of the CAM was observed to be normal. From the results obtained, it was obvious that the vessel diameters of the CAM did not change significantly over time. It was also noted that in Group A and B diameter increased which shows that NapS increases diameter in higher concentrations. However, there is no significant statistical difference between both groups as P=0.010. On the other hand, in low concentrations, NapS worked as an anti-angiogenic agent and diameter of blood vessels decreased with a significant difference among control and treated groups (P=0.000) as showed in Figure 4 .

All the diameters of blood vessels in all treated and control groups with respect to their branching are summarized in Table 2 .

Branching Pattern of Blood Vessels
The present study was also performed to investigate the development of blood vessels by the selection of a capillary plexus. To recognize this developmental process of blood vessels transformation, a series of photographs was recorded with a computer simulation of the process of in vivo vascularization. The simulation established that a positive feedback system contributed in the development of a branching pattern. As the embryo grew, it was witnessed that in Groups A and B, there was a fork branching pattern while in group C, D and E, there was polygonal and/or tree capillary networks as showed in Figure 5 . An area where progress was rapidly received much blood flow and produced finer networks of capillaries.

Discussion
The CAM model is widely used in angiogenic investigation and is principally appropriate for the study of diseases categorized by proliferative retinal vasculature, such as age-related macular degeneration Tufan and Satiroglu-Tufan, 2005. In the current effort, this model was used in order to determine the angiogenic and/or anti-angiogenic effect of Naproxen sodium (NapS) and determine the effective dose of NapS for angiogenesis.
The effects of drug visualized in Figure 1 show that NapS is angiogenic at higher concentration and anti-angiogenic at low concentrations. Similar studies were conducted by Blacher et al. (2005) Blacher et al., 2011. They used new advances in imaging investigation to quantify CAM angiogenic response, covering all vascular components, from the large supplying and feeding vessels down to the capillary plexus. Their morphometric investigation highlighted that a precise quantification of the CAM vasculature desires to be executed at several scales Blacher et al., 2011.
Quantitative analysis was performed including imaging studies, roughness analysis and diameter of blood vessels. The NapS was applied on CAM and images were captured at uniform time intervals. The images captured were then analyzed with the software. These were transformed into three dimensional views as shown in Figure 2 . These were prepared to know the better understanding of blood vessels networks.
There are no worldwide gauges for roughness investigation in light of surface pictures yet, however the actualized calculations are in assertion suggestions from driving specialists and a large portion of the definitions are regular augmentations of the ISO norms for surface profiles. With respect to all other expository outcomes the roughness parameters are composed to records, which can be transported in by worksheet suites and utilized for factual purposes. We also performed this parameter to check the roughness of images. These factors illuminate the variances in surface roughness between control and treated CAMs. The Abbott curve, a graphical picture of roughness, was also dignified to appraise even slight changes in the stature of blood vessels on the surface of CAMs. Abbott curve heights for control and treated CAMs were observed as shown in figure 3. This shows that roughness was found high in group A and B while in group C, D and E, roughness was comparatively low. Similarly, same roughness parameter was observed by Hussain et al. (2011) Hussain, 2011. In their study, the average values of roughness in the control group were high in relation to treated CAMs. It portrayed that surface roughness analysis, demonstrating neo-vascularization of treated CAMs was expressively (P<0.05) less than that of control CAMs Hussain, 2011.
The captured images were assessed with the software to determine the vessel diameters. Different segments in a selected area for measurement were identified. The respective diameters of each vessel portion located in distinct segments were identified using the software. Using this procedure, the diameter of a specific vessel was determined automatically at each time point for the respective drug concentration. The dispersal of the vessel diameter of the CAM was observed to be usual. From the investigations, it was obvious that the vessel diameters of the CAM did not modify meaningfully over time. It was also observed that in Group A and B diameter increased which shows that NapS increases diameter in higher concentrations. However, there is no significant statistical difference between both groups. On the other hand, in low concentrations, NapS worked as an anti-angiogenic agent and diameter of blood vessels decreased with a significant difference among control and treated groups (P=0.000) as shown in figure 4. Another study was conducted by Salas (2015) Salas, 2015 to assess the phytochemical components and properties of herbal plant extracts, such as Gynura nepalensis, Pandanus odoratissimus L. and Carmona retusa masam, as potential angiogenesis inhibitors using the CAM assay. They found similar reduction in diameter with Carmona retusa masam.
The current research was also executed to investigate that blood vessels are fashioned by the capillaries selection in the plexus. To recognize the developmental phenomena of blood vessel branching pattern, a series of radiographs was successfully recorded, and a computer simulation was carried out by the process of in vivo vascularization. The simulation established that a positive feedback system contributed in the development of a branching pattern. As the embryo grew, it was witnessed that in Groups A and B, there was a fork branching pattern while in group C, D and E, there was polygonal and/or tree capillary networks as shown in Figure 5 . An area where progress was rapidly received much blood flow and produced finer networks of capillaries.
Conclusion
It is concluded that the presentation of Naproxen sodium on CAM on 6th day of incubation showed angiogenic effects in high concentration and anti-angiogenic effect in low concentration. Results indicated noticeable modifications in CAM design, weakening of blood vessels, reduction in surface roughness parameters, and decrease in Abbott curve. The significant amounts of Naproxen sodium may reveal anti-angiogenic activity in the similar fashion as those seen in vitro and describe its clinical efficacy.
Abbreviations
AG: Angiogenesis
CAM: Chorioallantoic membrane
NapS: Naproxen sodium
SPSS: Statistical package for social sciences
Author's contribution
Hafiz Muhammad Shoaib Zahid conducted the research, Tanveer Ahmed Khan performed data analysis, Muhammad Ijaz-ul-Haq drafted the manuscript, Humayun Riaz reviewed the manuscript, Syed Atif Raza supervised the study, and Zia Mohy-ud-din Khan performed graphical interpretation.
References
-
A.
Abdollahi,
J.
Folkman.
Evading tumor evasion: current concepts and perspectives of anti-angiogenic cancer therapy. Drug Resistance Updates.
2010;
13
:
16-28
.
-
G.
Bergers,
L.E.
Benjamin.
Tumorigenesis and the angiogenic switch. Nature reviews cancer.
2003;
3
:
401-410
.
-
S.
Blacher,
L.
Devy,
R.
Hlushchuk,
E.
Larger,
N.
Lamandé,
P.
Burri,
P.
Corvol,
V.
Djonov,
J.-M.
Foidart,
A.
Noël.
Quantification of angiogenesis in the chicken chorioallantoic membrane (CAM). Image Analysis & Stereology.
2011;
24
:
169-180
.
-
A.W.
Griffioen,
G.
Molema.
Angiogenesis: potentials for pharmacologic intervention in the treatment of cancer, cardiovascular diseases, and chronic inflammation. Pharmacological reviews.
2000;
52
:
237-268
.
-
A.T.
Hertig.
Angiogenesis in the early human chorion and in the primary placenta of the macaque monkey. Contrib Embryol.
1935;
25
:
39-81
.
-
I.
Hussain,
M.O.
Omer,
M.
Ashraf,
Habib-Ur-Rehmanm.
Effect of diclofenac sodium angiogenesis using chorioallantoic membrane (cam) assay. Journal of applied pharmacy.
2011;
:
320-330
.
-
G.M.
Salas,
E.V.
Totaan.
Selected Philippine Herbal plant extracts as Angiogenesis inhibitors using Chick Chorioallantoic Membrane (CAM) assay. International Research Journal of Biological Sciences.
2015;
:
28-32
.
-
A.C.
Tufan,
N.L.
Satiroglu-Tufan.
The chick embryo chorioallantoic membrane as a model system for the study of tumor angiogenesis, invasion and development of anti-angiogenic agents. Current cancer drug targets.
2005;
5
:
249-266
.
Comments
Downloads
Article Details
Volume & Issue : Vol 4 No 05 (2017)
Page No.: 1281-1294
Published on: 2017-05-20
Citations
Copyrights & License
This work is licensed under a Creative Commons Attribution 4.0 International License.
Search Panel
Pubmed
Google Scholar
Pubmed
Google Scholar
Pubmed
Google Scholar
Pubmed
Google Scholar
Pubmed
Google Scholar
Pubmed
Search for this article in:
Google Scholar
Researchgate
- HTML viewed - 6234 times
- Download PDF downloaded - 1745 times
- View Article downloaded - 11 times
