

Copyrights: Zafer Saad Al Shehri, 2017. License: This work is licensed under a Creative Commons Attribution 4.0 International License.
Abstract
Introduction: The aim of this study was to investigate various biochemical and hematological parameters in patients with type 2 diabetes mellitus (T2DM) and compare those with non-diabetic subjects (control group).
Subjects: The study was conducted on 405 subjects (ages ranging from 26-65 years old; sex matched) who were classified into two groups: diabetic (n=205 subjects; males-105, females-100) and non-diabetic subjects (n=200; males-100, females-100). The study was carried out during the period of November 2016 to April 2017 in the Department of Clinical Laboratory Sciences at the College of Applied Medical Science Al-Dawadmi, Shaqra University in Saudi Arabia (with the collaboration of the General Hospital Al-Dawadmi).
Methods: The following various parameters were assessed for all subjects: body mass index (BMI), systolic and diastolic blood pressure (SBP-DBP), fasting blood sugar (FBS), serum glutamic pyruvic transaminase (SGPT), alkaline phosphatise (ALP), total cholesterol (T. Ch), triglyceride (TG), low-density lipoprotein (LDL), high density lipoprotein (HDL), hemoglobin (HB), red blood cell count (RBC), hematocrit (Ht), mean corpuscular volume (MCV), mean corpuscle hemoglobin concentration (MCHC), mean corpuscular hemoglobin (MCH), red cell distribution width (RDW), platelet count (Plt), mean platelet volume (MPV), platelet distribution width (PDW), total white blood cell count (WBC), lymphocyte count (L), neutrophil count (N), eosinophil count (E), monocyte count (M), basophil count (B), neutrophil/lymphocyte ratio (N/L), and platelet/lymphocyte ratio (P/L).
Results: The results showed an increase in the mean values of SGPT, alkaline phosphatase, urea, serum creatinine, total cholesterol, triglyceride, and LDL in the T2DM group relative to the control group. Meanwhile, the mean value of HDL was significantly decreased in the T2DM group compared to the control group (p<0.05). The mean values of hemoglobin, RBC, MCV, MCHC and MCH were significantly decreased in the T2DM group compared to the control group. In contrast, the red cell distribution width significantly increased in the T2DM group versus control group (p<0.05). The mean platelet count was not significantly changed in the T2DM group compared to the control group (p> 0.05), but the mean values of PDW and MPV were significantly higher in the T2DM group compared to the control group (p<0.05). The mean white blood cell count and differential white blood cell was significantly higher in the T2DM group compared to control group (p<0.05). Lastly, the mean neutrophil/lymphocyte ratio and platelet/lymphocyte ratio was not significantly different in the T2DM group compared to control group (p>0.05).
Conclusion: In diabetes mellitus type 2 patients, certain biochemical and hematological changes are distinct from healthy subjects. It is important to follow up and monitor these parameters carefully in diabetic patients.
Introduction
Diabetes mellitus is a very common endocrinal disorder affecting a majority of the world population and reaching to epidemic proportions in some countries Guariguatart al., 2013. In Saudi Arabia, diabetic patients are increasing day by day and these may be due to shifts in lifestyle, increase rates of consumption of fast foods and beverages containing high levels of sugars (e.g. sodas), lack of exercise, unhealthy diet, obesity, obesity, and socioeconomic changes over the past four decades Zahid, 2015.
Diabetes mellitus can be defined as a group of metabolic disorders that are characterized by several defects in the regulation of carbohydrate, fat or protein metabolism, or all of the above Guyton et al., 2002. Diabetes mellitus is characterized by hyperglycemia, glycosuria, hyperlipidemia, and negative nitrogen balance. Hyperglycemia in diabetes mellitus results from defects in insulin secretion or function, or both. The metabolic deregulation may be associated with secondary damage to multiple organ systems, especially the nerves, eyes, blood vessels and kidneys. The incidence of diabetes mellitus is on the rise worldwide Aslan et al., 2006.
The relationship between some components of metabolic syndromes and leukocytes was noted in several epidemiological studies that showed an association between total white blood cell count (WBC) and diabetes mellitus Barzilay et al., 2001. Leukocyte plays an important role during inflammation and also play some roles in the development of diabetes Fu-Mei et al, 2005. There are common findings of reduced hemoglobin concentrations in diabetic patients Thomas et al, 2003. The liver plays an important role in carbohydrate metabolism as it has the capability to store glucose as glycogen and synthesize glucose from non-carbohydrate sources Levinthal and Tavill, 1999. Increased activities of liver enzymes such as aspartate aminotransferase (AST) and alanine aminotransferase (ALT) are indicators of hepatocellular injury and also associated with insulin resistance Marchesiri et al, 2001, metabolic syndrome and type 2 diabetes Sattar et al, 2004 and Wannamethee et al, 2005. Diabetic patients may have induced dyslipidemia. Dyslipidemia is characterized by elevated levels of total cholesterol, triglycerides, low levels of HDL, and increased low-density lipoprotein (LDL) Nakanishi et al, 2005.
In the present study we aim to study various biochemical and hematological changes among Type 2 diabetes mellitus patients in Saudi Arabia.
Materials-Methods
Study subjects
This study consisted of 405 subjects (ages ranging from 26-65 years; sex matched) who were classified into two groups. The first group consisted of diabetic patients (n=205; males-105, females-100) and the second group consisted of non-diabetic subjects (n=200; males-100, females-100). The study was carried out during the period of November 2016 to April 2017 in the Department of Clinical Laboratory Sciences at the College of Applied Medical Science Al-Dawadmi, Shaqra University in Saudi Arabia (with the collaboration of the General Hospital Al-Dawadmi). All diabetes mellitus cases were clinically diagnosed by a specialized clinician. The patients were admitted to the General Hospital Al-Dawadmi. Patients with defective renal or hepatic diseases, acute infections and/or hematologic diseases with WBC count >15,000/mm3 were excluded. Height and weight were measured using height and weight scales in ZT-120. BMI was calculated as weight in kilograms divided by height in meters squared. Any BMI values from 23.0-24.9 kg/m2 were considered as overweight and >25.0 kg/m2 as obese (WHO 2000).
Ethics approval and consent
The study was conducted after ethics approval from the Institutional Ethical Committee of Shaqra University, and all participants signed an informed consent form before the study assessments.
Laboratory evaluations
Consent was taken from every subject and they were requested to fast overnight (10 to 12 hrs). Blood samples were collected by venipuncture from non-diabetic and diabetic subjects. The serum samples were separated after allowing them to clot by centrifugation at 2500 rpm for 10 minutes at room temperature and were stored at -20°C until tested. Blood samples were treated as follows: for SGPT/ ALT, total cholesterol, urea & creatinine estimation 4 mL of whole blood was taken in a plain test tube and serum was separated by centrifugation at 2500 rpm. However, in the case of glucose testing, 2 mL of blood was taken into a separate test tube containing fluoride fluid and within one hour of sample collection, plasma was separated. For estimation of CBC, 2 mL of blood was taken in a separate test tube containing ethylene di-amino tetra acetic acid (EDTA). Complete blood counts (including WBC, differential count and hemoglobin) were performed in an automatic counting machine (Cell-Dyn Ruby, Abbott Inc., Illinois, USA; Sysmex 1800i, Japan). Plasma glucose and other biochemical parameters (SGPT/ALT, total cholesterol, urea, and creatinine) were measured in the BIRDEM Biochemistry Laboratory, Dhaka, by the following mentioned methods.
Biochemical and Hematological Evaluations
The levels of fasting blood sugar (FBS), total cholesterol, SGPT/ALT, urea, and creatinine were measured by commercially available kits (Bio-Rad Laboratories, Richmond, USA; Randox laboratories Ltd., Antrim, UK; Merck, Germany; Sigma Chemicals Co., USA; Roche international Inc., USA; Johnson & Johnson Inc., New Jersey, USA) by Dade Behring, Hitachi-912 and Vitros-250 (Dry Chemistry) automated chemistry analyzers. The glucose test was done with the modified hexokinase-glucose-6-phosphate dehydrogenase method, presented as a general clinical laboratory method by Kunst et al. Kunst A at al., 1983. The normal values are as follows: SGPT/ALT (up to 40 U/L), urea (10-50 mg/dL), creatinine (0.67-1.2 mg/dL), and total cholesterol (<200 mg/dL). The normal hematological parameters are as follows: WBC (4000-10,500/cm), hemoglobin (males: 13-17 g/dL; females: 12-15 g/dL), ESR (males: <10; females: <20 mm in 1st hr (western green)), differential counts for neutrophil (40-70%), lymphocytes (20-45%), monocytes (2-8%), and eosinophils (1-5%). All biochemical tests were done at 37°C.
Statistical Analysis
Statistical Package for Social Sciences version 19.0 was used to perform the statistical analyses. The data were expressed as mean±SD or expressed as %. The mean values were tested for significance using a test for paired samples, the Student’s t-test and Mann-Whitney U test. Pearson’s Chi-square test was also used to compare the categorical variables between these two groups. To determine the relationship between N and L in the N/L ratio, the Spearman correlation analysis was used. The values was regarded as statistically significant when P < 0.05.
Results
Demographic and characteristics of the study participants
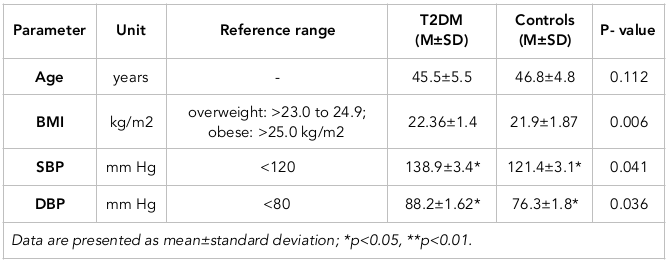
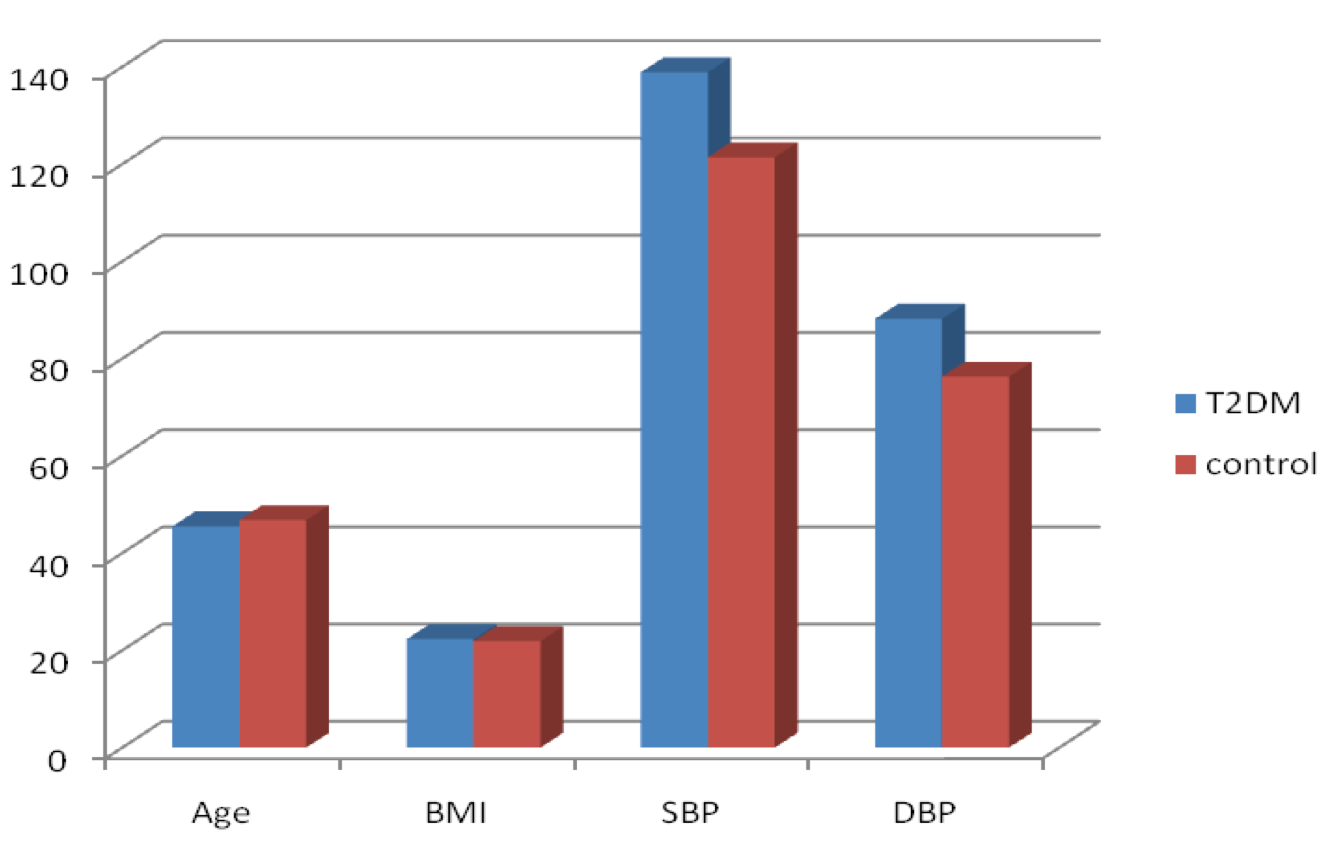
The results showed that the mean levels of systolic and diastolic blood pressure (BP) levels were significantly higher in T2DM patients than in the healthy, non-diabetic (control) group (P<0.05); the body mass index showed a nonsignificant difference between the two groups ( Table 1 ; Figure 1 ).
Biochemical laboratory assessments
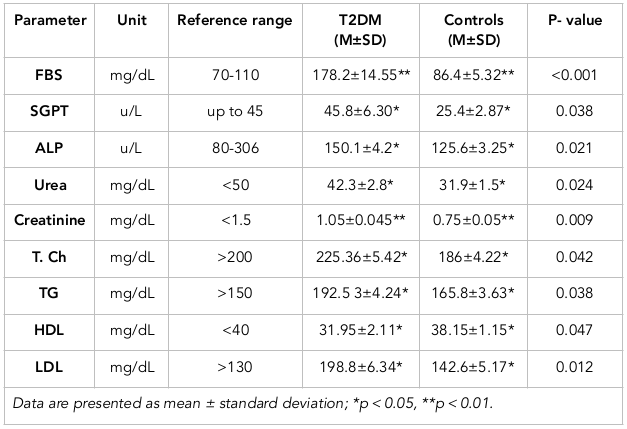
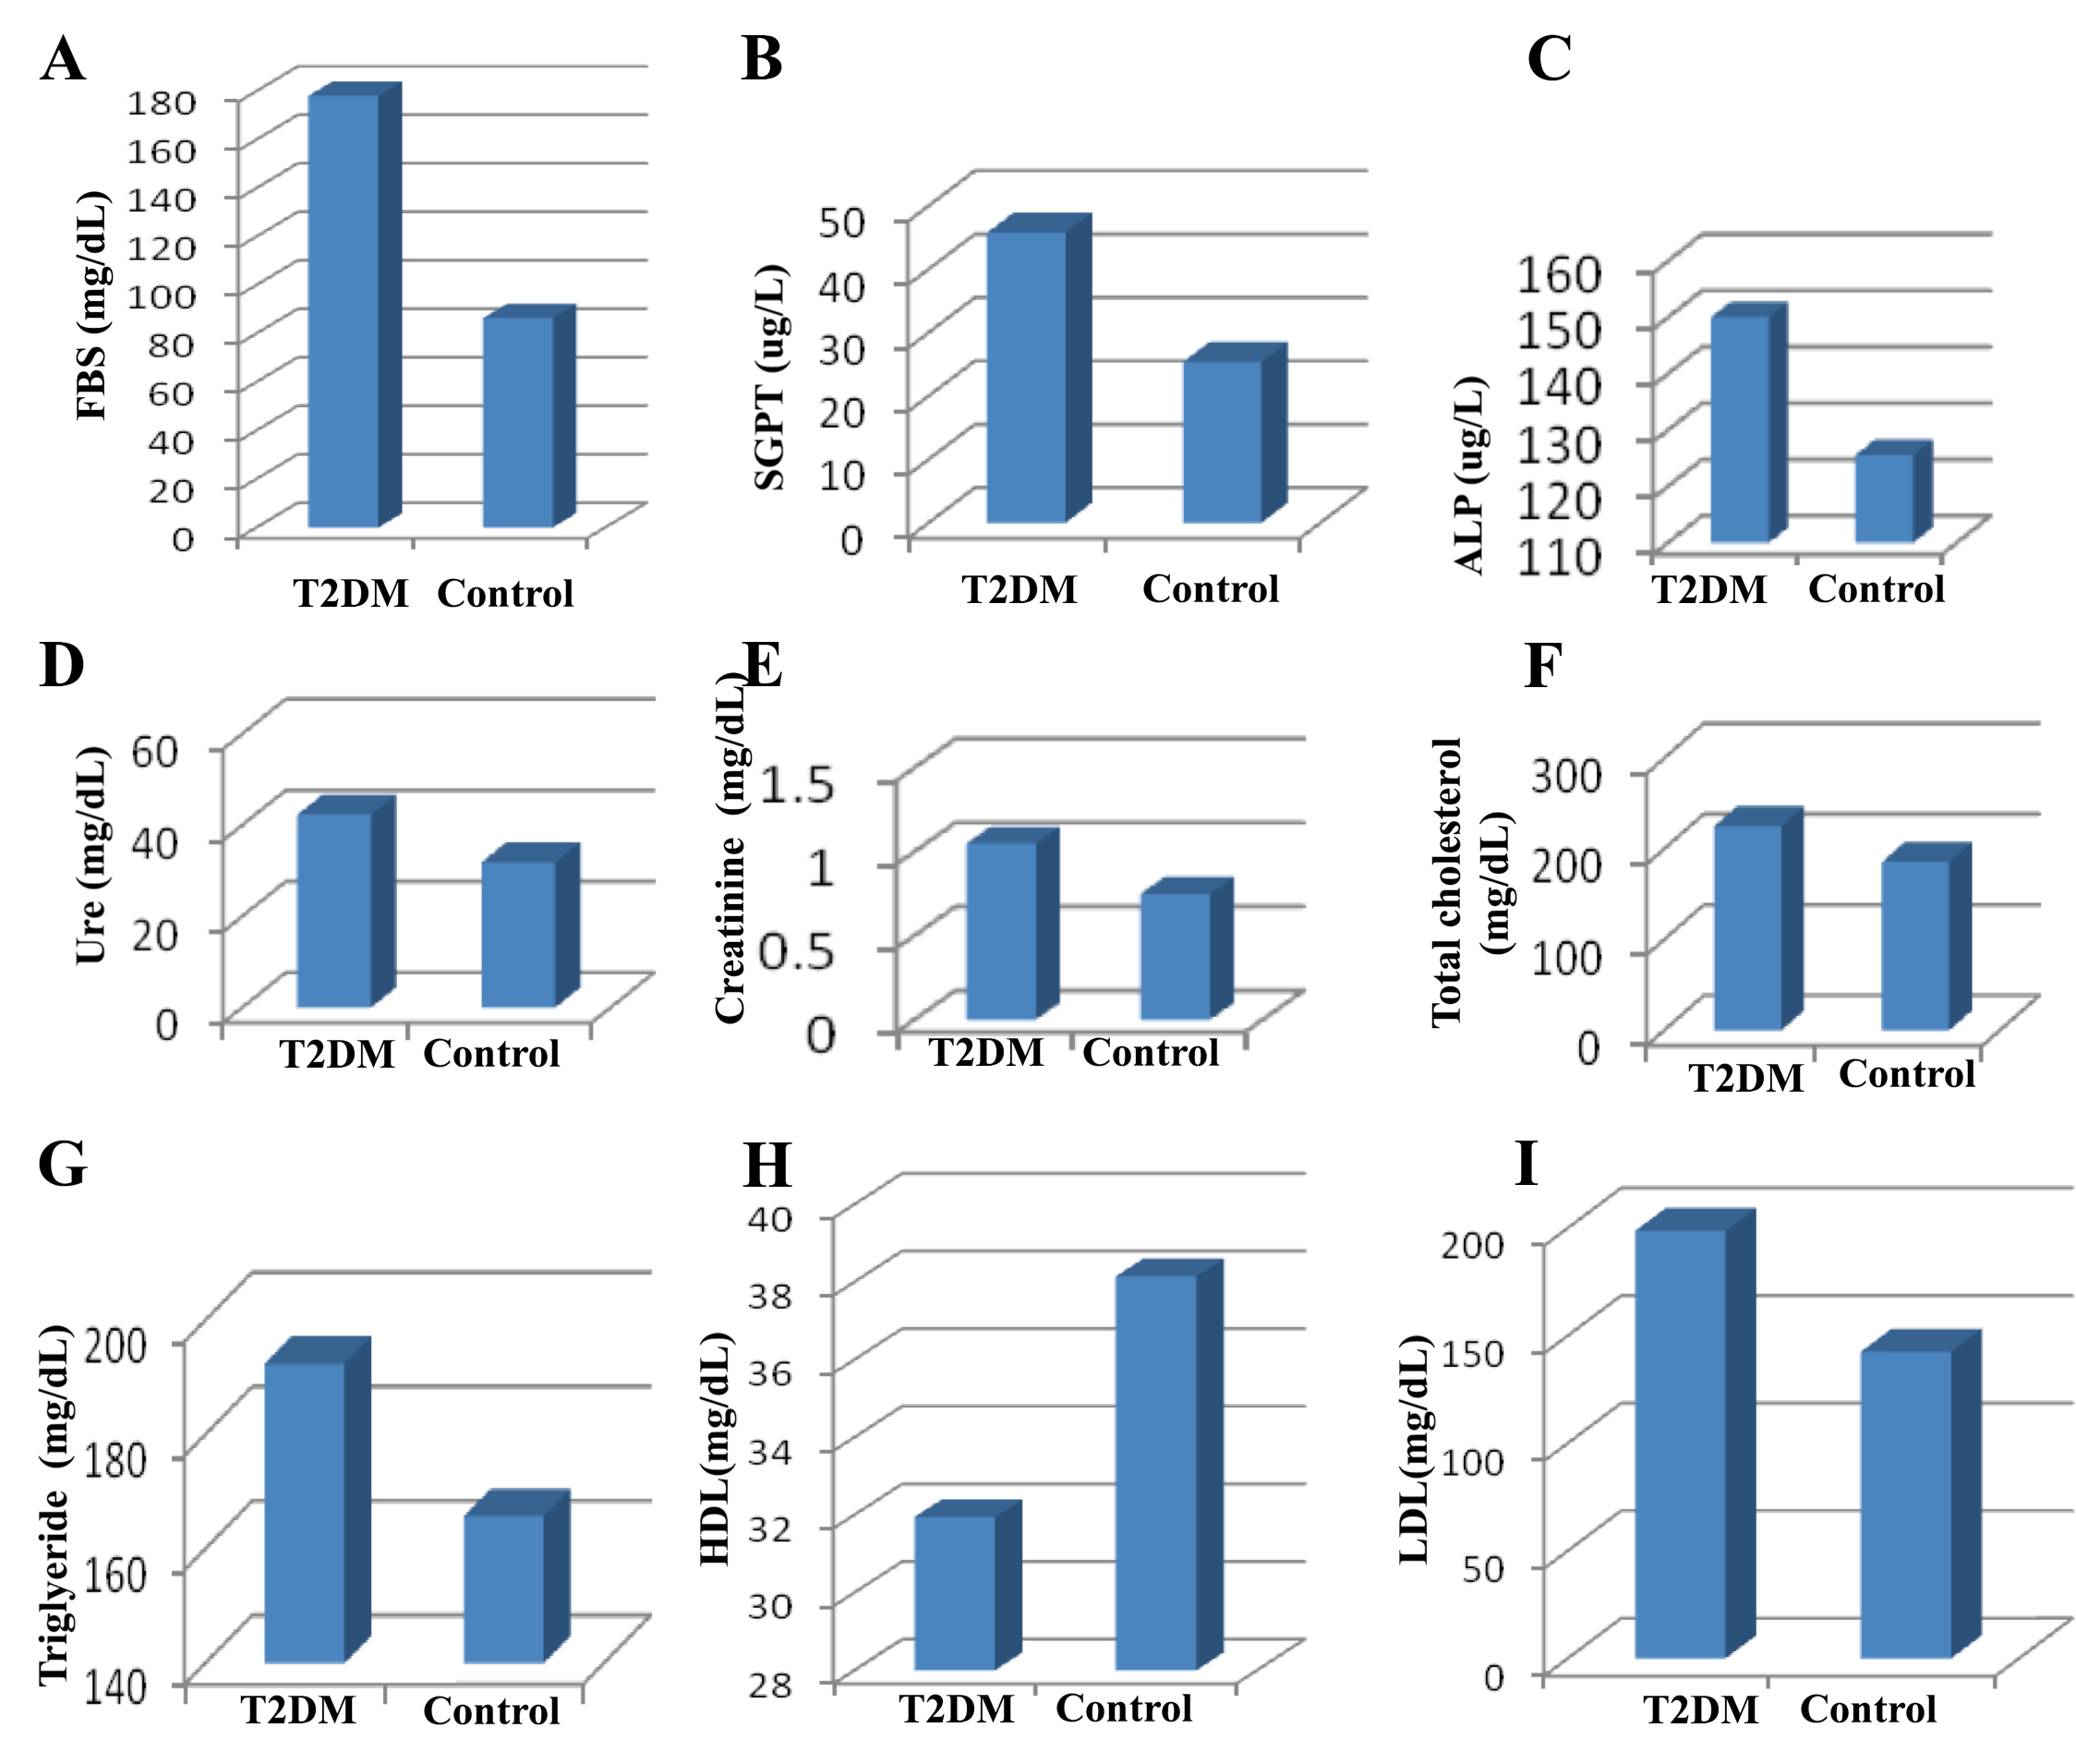
The results showed that there was an increase in the T2DM group compared to the control group with respect to the the mean values of the following parameters (values indicated): SGPT (45.8±6.30), alkaline phosphatise (150.1±4.2), urea (42.3±2.8), creatinine (1.05±0.045), total cholesterol (225.36±5.42), triglyceride (192.53±4.24), LDL (198.8±6.34) for the T2DM group, versus (25.4±2.87), (125.6±3.25), (31.9±1.5), (0.75±0.05), (186±4.22), (165.8±3.63), and (142.6±5.17), respectively, for the control group ( Table 2 ; Figure 2A-H ). Meanwhile, the mean value of HDL for the T2DM group (31.95±2.11) was significantly lower compared to that of the control group (38.15±1.15) ( Table 2 ; Figure 2I ).
Hematological parameters of diabetes mellitus patients
The mean values of hemoglobin, RBC, MCV, MCHC, and MCH significantly decreased (p<0.05) in the T2DM group compared to the control group; the respective values were (11.89±1.25), (4.32±0.75) (81.45±3.1), (26.4±2.87) and (29.8±3.1) for the T2DM group, compared to (12.69±1.96), (4.72±0.96), (85.63±5.2), (27.47±3.6) and (32.52±2.29) for the control group ( Table 3 ; Figure 3A-F ). In contrast, the RDW showed a significant increase (p<0.05) in the T2DM group (14.57±3.1), compared to the control group (12.63±2.58) ( Table 3 ; Figure 3G ).
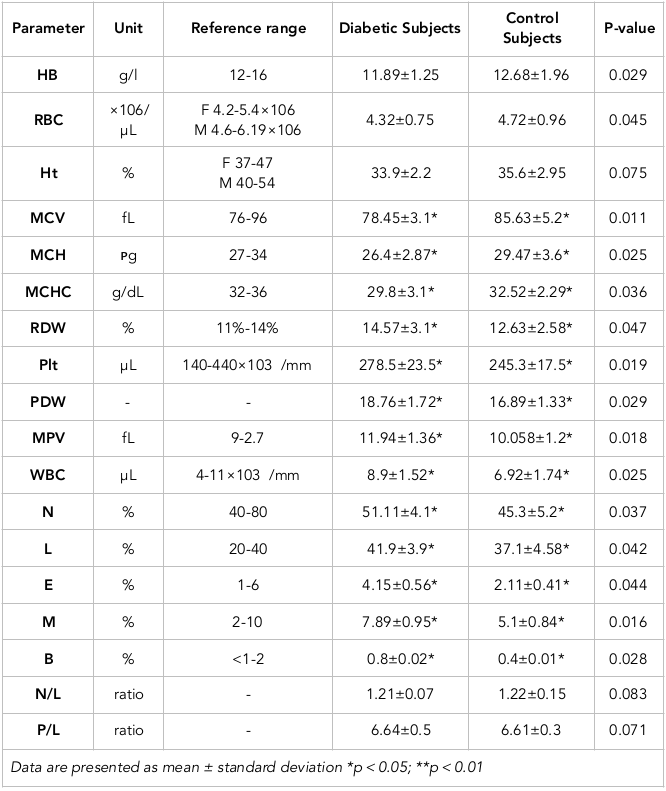
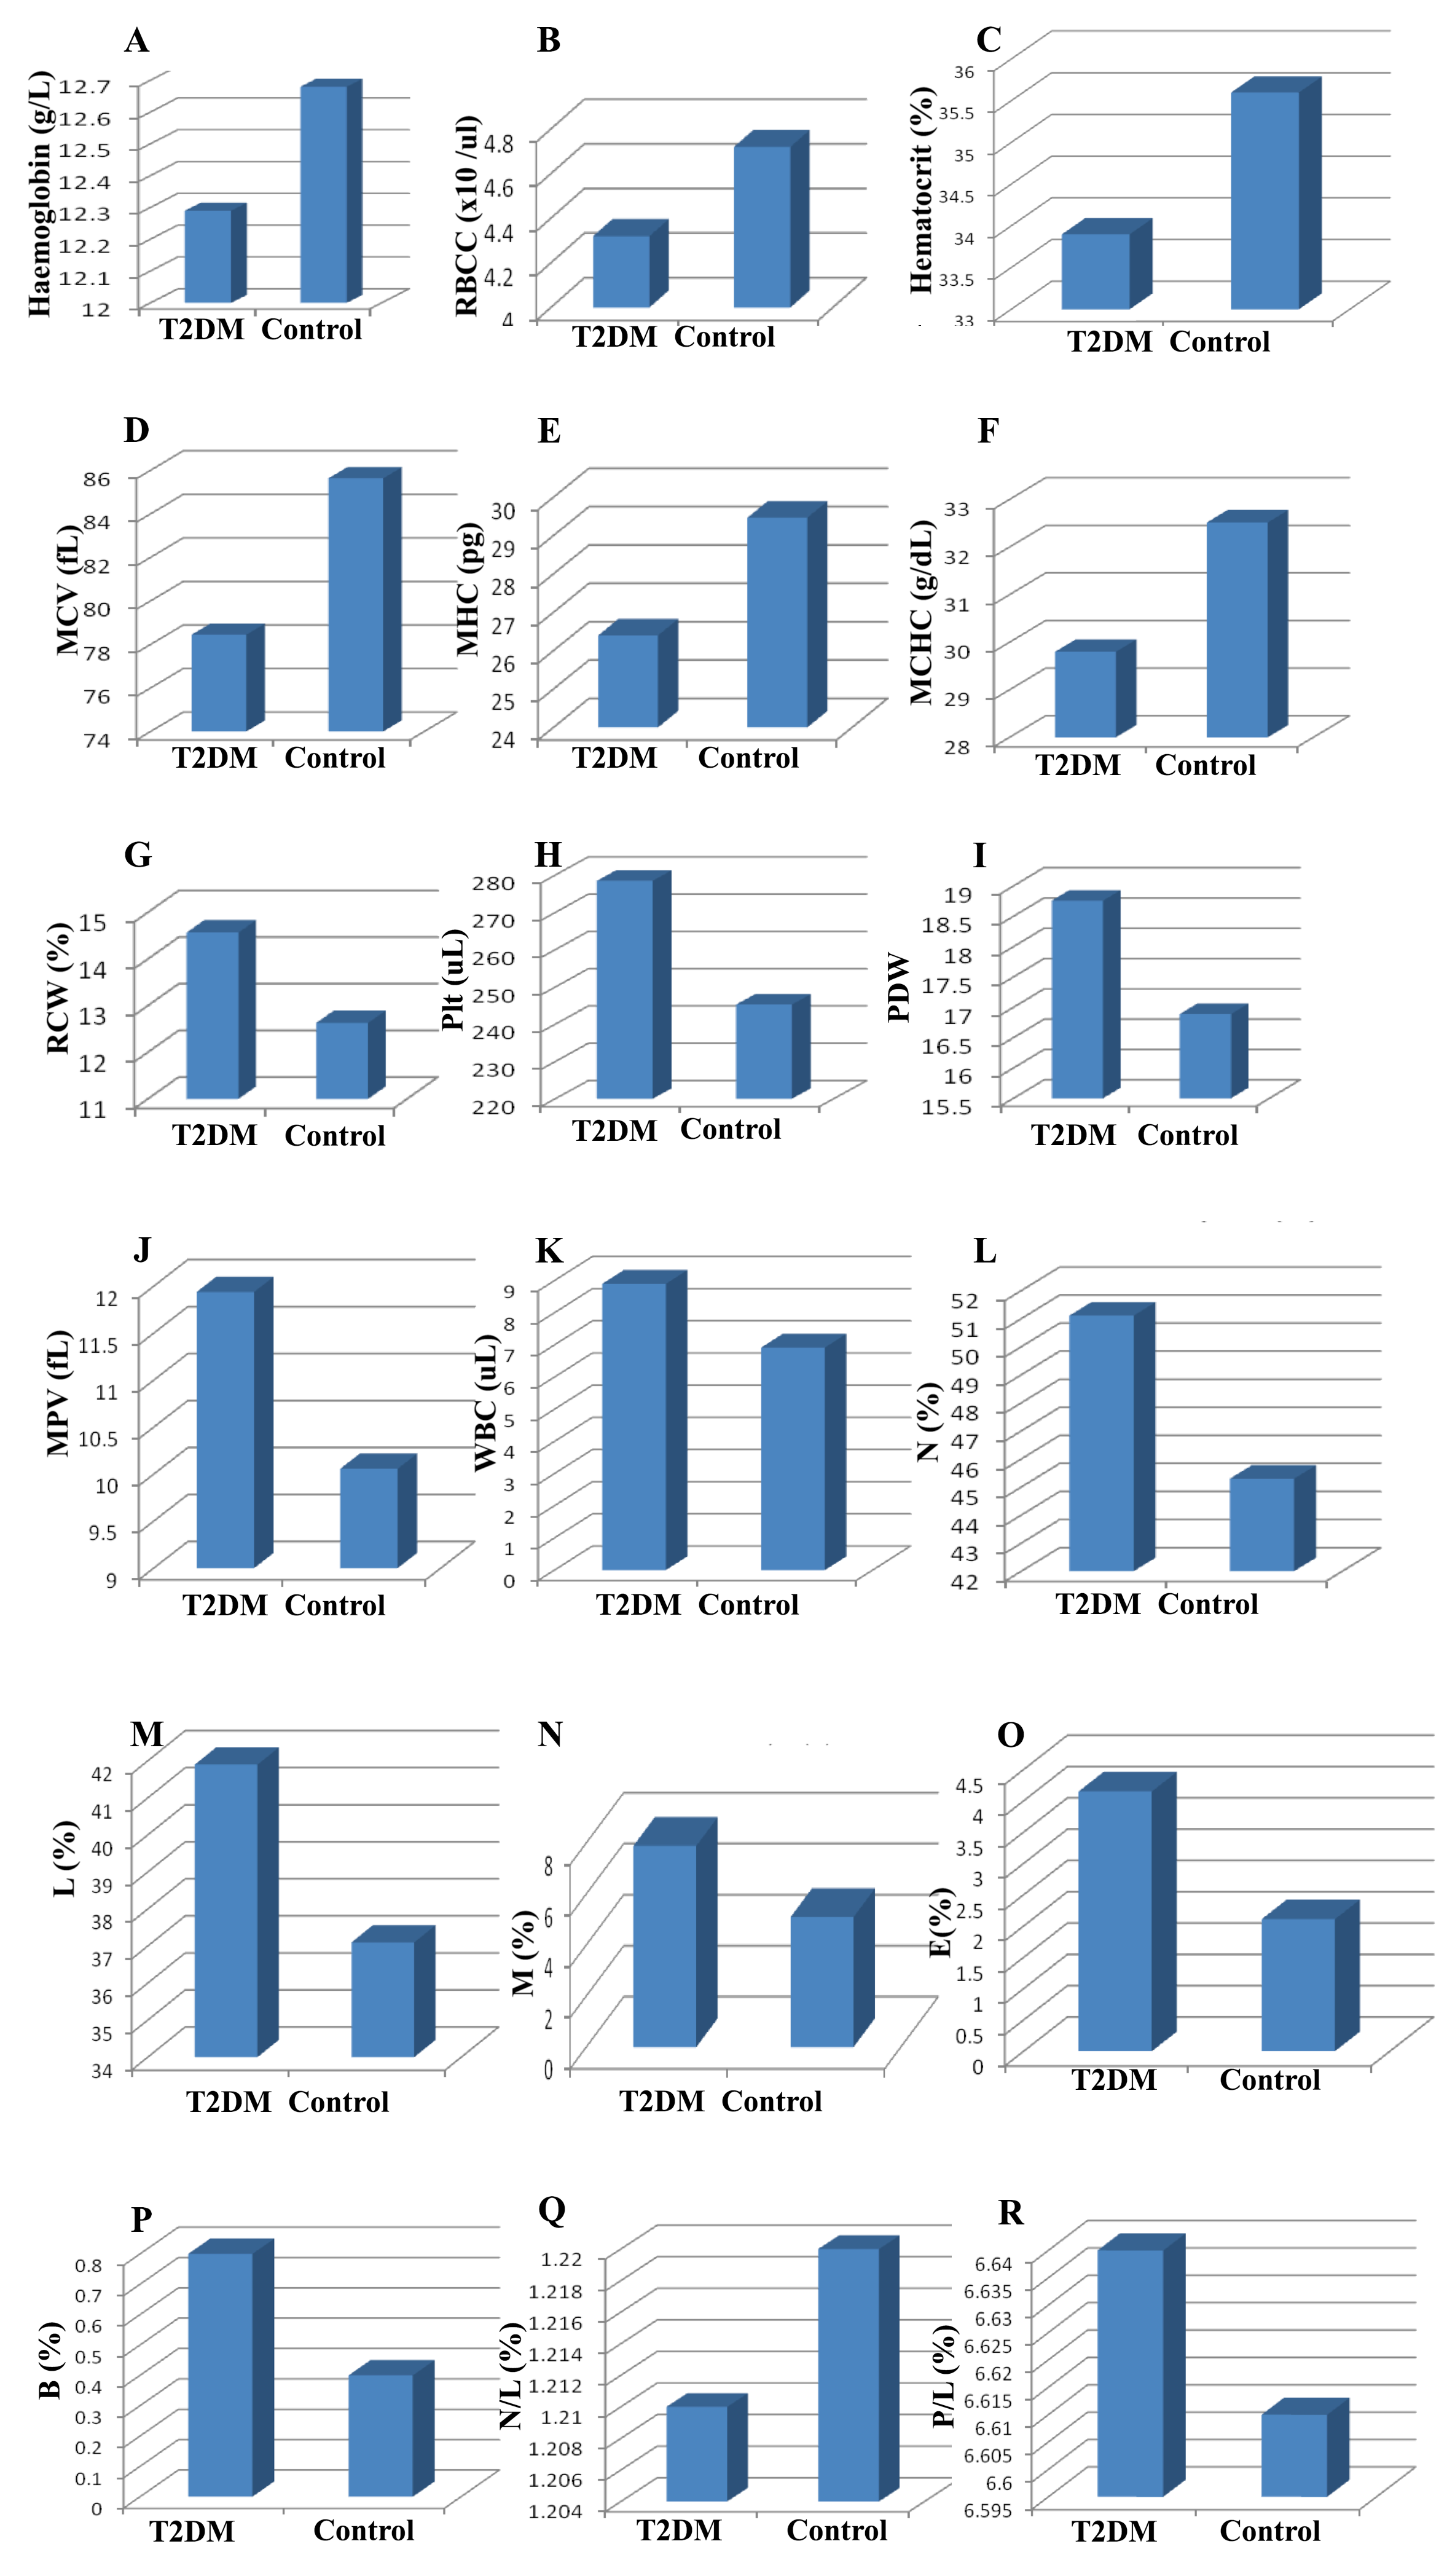
For the T2DM group, the mean platelet count (278.5±23.5), mean PDW (18.76±1.72), and MPV (11.94±1.36) were all significantly higher than for healthy persons, whose parameters were (245.3±17.5), (16.89±1.33) and (10.058±1.2), respectively ( Table 3 ; Figure 3H-J ). The mean white blood cell count was significantly lower (p<0.05) for the T2DM group (7.89±1.52) than control group (6.92.15±1.74). Moreover, the differential white blood cell count in terms of percentage of neutrophils, lymphocytes, eosinophils, monocytes and basophils were also significantly lower in the T2DM group; the respective values for each were (51.11±4.1), (41.9±3.9), (4.15±0.56), (7.89±0.95) and (0.8±0.02), as compared to the control group whose values were (45.3±5.2), (37.1±4.58), (2.11±0.41), (5.1±0.84) and (0.4±0.01), respectively (p<0.05) ( Table 3 ; Figure 3K-Q ).
The mean neutrophil/lymphocyte (N/L) ratio and platelet/lymphocyte (P/L) ratio were not significantly different for the T2DM group compared to the control group. The respective parameters/values for the T2DM group were: N/L (1.21±0.07) and P/L (6.64±0.5); for the control group the values were (1.22±0.15) and (6.61±0.3), respectively (p>0.05) ( Table 3 ; Figure 3S-3R ).
Discussion
The results revealed that there is a strong relationship between increase of blood glucose sugar level and blood urea and serum creatinine levels; the increase may be due to damage in the kidney Muragundla and Kanwaljitquercetin. The decrease in kidney function in diabetic patients may be due to several reasons including changes in urinary albumin excretion rate, glomerular filtration rate, and glycosylated hemoglobin (HbA1c) levels Thomas al., 2003.
Hyperglycemia is one of the major causes of progressive renal damage. Diabetes is an epidemic disease and considered to be the most common cause of kidney disease. Typically, patients with diabetes should be investigated periodically for nephropathy and be assessed/monitored regularly for levels of serum creatinine, blood urea and urine albumin Advance, 2008.
The results of the study showed there was an increase in the mean values of SGPT and alkaline phosphatise. Similar studies have shown that type 2 diabetes is associated with a clinical spectrum of liver abnormalities and have found higher levels of GGT, ALT and ALK in the patients Balogun 2008. In addition the study by Ohlson et al., 1988, it has been demonstrated that abnormal liver function (including increased levels of liver enzymes ALT and GGT) is frequently associated with type 2 diabetes mellitus. Control of blood sugar level is essential to prevent nephropathy; delaying it may cause many medical problems.
Moreover. the biochemical results in this study showed that there was an increase in the mean values of triglyceride, total cholesterol and LDL, whereas the mean value of HDL significantly decreased. Our results are consistent with those of previous studies which have indicated that diabetes is associated with increased lipolysis, triglyceride synthesis and hepatic uptake of free fatty acids, and with accumulation of hepatic triglycerides due to insulin resistance Pagano, 2002.
Furthermore, the results showed a decrease in the mean values of hemoglobin, red blood cell count, hematocrit, mean corpuscular volume, mean corpuscular hemoglobin, and mean corpuscular hemoglobin concentration in the T2DM patients versus the control group. Indeed, other studies have shown that several morphological changes in RBCs are strongly present in diabetic patients. Such changes include anisocytosis, poikilocytosis, and hypochromia; these changes may have a direct impact on erythrocyte function and may contribute to the patient’s complex pathology Neam et al., 2015. Many previous studies demonstrated that in uncontrolled T2DM patients, erythrocytes persist throughout their life span in the hyperglycemic environment and thus subjected to a series of changes which in turn affect their flow properties and functions Sing et al., 2009. Other studies have shown that erythrocytes also suffer from alteration of oxygen affinity Jones et al., 1981. Anaemia is common in patients with diabetes due to the high burden of chronic kidney disease (Thomas, 2007), glycosylation of red blood cells membrane protein Oyedemi et al., 2011, and several other defects found in the diabetic population Weiss, 2005 and Arun, 2002.
The study results demonstrated that levels of WBCs and differential leukocyte counts (including for neutrophils, lymphocytes, eosinophils, monocytes, and basophils) were slightly increased in T2DM patients compared to controls. The study by Vozarova et al., 2002 reported that there is relationship between WBC and diabetes mellitus as a result of increased inflammatory mediators. Inflammatory agents, insulin and human blood components form a critical signal for any abnormalities, resulting in invasion by foreign agents and/or inflammation Ohshita et al., 2004. These latter factors can induce defense mechanisms and contribute to changes in levels of blood parameters, including mean white blood cell count, mean platelet count, and phagocyte percentage Weyer et al., 2000.
Moreover, the study results showed an increase in the mean values of platelet, mean platelet volume, and platelet distribution width in diabetic patients compared to the control group. This increase may be a reflection of platelet activation. Many previous studies have demonstrated that platelets have large and variable sizes as can be observed in several clinical conditions, such as hemorrhage and myeloproliferative disorders. The increase may also indicate microvascular dysfunction Beyan et al., 2006.
Our results are in agreement with other results which have shown that patients with diabetes mellitus show altered platelet function (such as high platelet counts and high MPV). It has been reported that diabetic patients are likely to experience an increased risk for vascular disease Papanas, 2004.
Conclusion
Type 2 diabetes mellitus is a serious public health problem. Underlying biochemical and hematological changes in T2DM patients may lead to the development of long-term complications and poor quality of life or death. Therefore, it is critical to follow up and monitor carefully biochemical and hematological parameters in diabetic patients.
Abbreviations
ALP: Alkaline phosphatase
B: basophil count
BMI: body mass index
DBP: diastolic blood pressure
E: eosinophil count FBS: fasting blood sugar HB:hemoglobin
HDL: high-density lipoprotein.
Ht: hematocrit
L: lymphocyte
LDL: low-density lipoprotein
M: monocyte count
MCH: mean corpuscular hemoglobin
MCHC: mean corpuscular hemoglobin concentration
MCV: mean corpuscular volume
MPV: mean platelet volume
N: neutrophil count
N/L: neutrophil/lymphocyte ratio
P/L: platelet/lymphocyte ratio.
PDW: platelet distribution width
Plt: platelet
RBC: red blood cell count
RDW: red cell distribution width
SBP: systolic blood pressure
SGPT: serum glutamic-pyruvic transaminase
T. Ch: total cholesterol
T2DM: type 2 diabetes mellitus
TG: triglyceride
WBC: white blood cell
References
-
ADVANCE Collaborative Group..
Intensive control of blood glucose and vascular outcomes in patients with type 2 diabetes. The New England Journal of Medicine.
2008;
358(24)
:
2560-2572
.
View Article Google Scholar -
G. S.
Arun,
K. G.
Ramesh.
Improvement of insulin sensitivity by perindopril in spontaneously hypertensive and streptozotocindiabetic rats. Indian Journal of Pharmacology.
2002;
34
:
156-164
.
-
M.
Aslant,
D. D.
Orhan,
N.
Orhan,
E.
Sezik,
E.
Yesilada.
In vivo Antidiabetic and Antioxidant Potential of Helichrysum Plicatum ssp. In Streptozotocin induced diabetic rats. Journal of Ethnopharmacology.
2006;
109
:
54-59
.
-
WO
Balogun,
JO
Adeleye,
KS
Akinlade,
KS
Adedapo,
M.Frequent.
Kuti.
Occurrence of high gamma-glutamyl transferase and alanine amino transferase among Nigerian patients with type 2 diabetes. The African Journal of Medical Sciences.
2008;
37
:
177-183
.
-
JI
Barzilay,
L
Abraham,
SR
Heckbert,
M
Cushman,
LH
Kuller,
HE
Resnick,
RP
Tracy.
The relation of markers of inflammation to the development of glucose disorders in the elderly: the Cardiovascular Health Study. Diabetes. Oct.
2001;
50(10)
:
2384-9
.
-
C.
Beyan,
K.
Kaptan,
A.
Ifran.
Platelet count, mean platelet volume, platelet distribution width, and plateletcrit do not correlate with optical platelet aggregation responses in healthy volunteers. Journal of Thrombosis and Thrombolysis.
2006;
22(3)
:
161-164
.
View Article Google Scholar -
F.-M.
Chung,
J. C.-R.
Tsai,
D.-M.
Chang,
S.-J.
Shin,
Y.-J.
Lee,
the Fu-mei Chung..
Peripheral Total and Differential Leukocyte Count in Diabetic Nephropathy. Diabetes Care.
2005;
28(7)
:
1710-1717
.
View Article Google Scholar -
D. R.
Guariguata,
D. R.
Whiting,
I.
Hambleton,
J.
Beagley,
U.
Linnenkamp,
J. E.
Shaw,
I
Whiting,
J
Hambleton,
U.
Beagley,
Linnenkamp,
J. E.
Shaw.
“Global estimates of diabetes prevalence for 2013 and projections for 2035 [View at Publisher · View at Google Scholar · View at Scopus]. Diabetes Research and Clinical Practice.
2014;
103(2)
:
137-149
.
-
A. C.
Guyton,
J. E.
Hall.
Medical Physiology (10th ed., pp. 797-801). London: W.B. Saunders.
2002
.
-
R. L.
Jones,
C. M.
Peterson.
Hematologic alterations in diabetes mellitus. The American Journal of Medicine.
1981;
70(2)
:
339-352
.
View Article Google Scholar -
A
Kunst,
B
Drager,
J
Ziegenhorn.
UV methods with hexokinase and glucose-6-phosphate dehydrogenasen, Methods of enzymatic Analysis, Vol. VI, Bergmeyer, HY, Ed, Verlag chemie Deerfield, FL., 163-172. 1983
.
-
G. N.
Levinthal,
A. J.
Tavill.
Liver disease anddiabetes mellitus. Clinical Diabetes.
1999;
17
:
73
.
-
G.
Marchesiri,
M.
Brizi,
G.
Bianchi.
Nonalcoholic fatty liver disaes. A feature of metabolic syndrome. Diabetes.
2001;
50(8)
:
1844-1850
.
-
Anjaneyulu,
Muragundla,
Chopra
Kanwaljit.
Quercetin, an anti-oxidant bioflavonoid, attenuates diabetic nephropathy in rats. Clinical and Experimental Pharmacology and Physiology.
2004;
31.4
:
244-248
.
-
N.
Papanas,
G.
Symeonidis,
E.
Maltezos,
G.
Mavridis,
F.
Karavageli,
T.
Vosnakidis,
G.
Lakasas.
Lakasas, Mean platelet volume in patients with type 2 diabetes mellitus. Platelets.
2004;
15(8)
:
475-478
.
View Article Google Scholar -
N. T. S.
Nakanishi,
M.
Wada.
Association between fasting glucose and Creactive protein in a Japanese population: The Minoh study. Diabete Res. Clinics and Practice.
2005;
69
:
88-98
.
-
MC1
Neam Ţu,
Ş
CrăiŢoiu,
ET
Avramescu,
DM
Margină,
MV
Băcănoiu,
D
Turneanu,
Miulescu R .
Dănciulescu.
The prevalence of the red cell morphology changes in patients with type 2 diabetes mellitus. Romanian Journal of Morphology and Embryology.
2015;
56(1)
:
183-189
.
-
L. O.
Ohlson,
B.
Larsson,
P.
Borntorp,
H.
Eriksson,
K.
Svardsudd,
L.
Welin.
Risk factors for type 2 (non-insulin-dependent) diabetes mellitus. Thirteen and one-half years of folow up of the participants in a study of sweedish men born in 1913. Diabetologia.
1988;
31
:
798-805
.
-
K.
Ohshita,
K.
Yamane,
M.
Hanafusa,
H.
Mori,
K.
Mito,
M.
Okubo,
N.
Kohno.
Elevated white blood cell count in subjects with impaired glucose tolerance. Diabetes Care.
2004;
27(2)
:
491-496
.
View Article Google Scholar -
S. O.
Oyedemi,
M. T.
Yakubu,
A. J.
Afolayan.
Antidiabetic activities of aqueous leaves extract of Leonotis leonurus in streptozotocin induced diabetic rats. Journal of Medicinal Plants Research.
2011;
5
:
119-125
.
-
G.
Pagano,
G.
Pacini,
G.
Musso,
R.
Gambino,
F.
Mecca,
N.
Depetris.
Nonalcoholic steatohepatitis, insulin resistance, and metabolic syndrome: Further evidence for an etiologic association. Hepatology (Baltimore, Md.).
2002;
35(2)
:
367-372
.
-
N. O.
Sattar,
I.
Scherbakova,
O. R.
Ford,
D. S.
Eilly,
E. A.
Stanley,
P. W.
Forrest,
J.
Cobbeand.
Shepherd. Elevated alanine aminotransferase predicts new-onset type 2 diabetes independently of classical risk factors metabolic syndrome, and Creactive protein in the west of Scotland coronary prevention study. Diabetes.
2004;
53(11)
:
2855-2860
.
-
M.
Sing,
S.
Shin.
Changes in erythrocyte aggregation and deformability in diabetes mellitus: A brief review. Indian Journal of Experimental Biology.
2009;
47(1)
:
7-15
.
-
M.
Thomas,
R.
Maclsaac,
C.
Tsalamandris.
Unrecognized anemia in patients with diabetes: A cross sectional survey. Diabetes Care.
2003;
26(4)
:
1164-1169
.
View Article Google Scholar -
M. C.
Thomas.
Anemia in diabetes: Marker of mediator microvascular disease. Nature Clinical Practice. Nephrology.
2003;
3(1)
:
20-30
.
-
B.
Vozarova,
C.
Weyer,
R. S.
Lindsay,
R. E.
Pratley,
C.
Bogardus,
P. A.
Tataranni.
Tataranni PA High white blood cell count is associated with a worsening of insulin sensitivity and predicts the development of type 2 diabetes. Diabetes.
2002;
51(2)
:
455-461
.
View Article Google Scholar -
S. G.
Wannamethee,
A. G.
Shaper,
L.
Lennon,
P. H.
Whincup.
Hepatic enzymes the metabolic syndrome and the risk of type 2 diabetes in old men. Diabetes Care.
2005;
28(12)
:
2913-291
.
View Article Google Scholar -
G.
Weiss,
L. T.
Goodnough.
Anemia of chronic disease. The New England Journal of Medicine.
2005;
352(10)
:
1011-1023
.
View Article Google Scholar -
C.
Weyer,
K.
Hanson,
C.
Bogardus,
R. E.
Pratley.
Long-term changes in insulin action and insulin secretion associated with weight gain, loss, regain and maintenance of body weight. Diabetologia.
2000;
43(1)
:
36-46
.
View Article Google Scholar -
N.
Zahid.
Burden of Diabetes Mellitus in Saudi Arabia. Int J Health Sci (Qassim).
2015;
Jul, 9(3)
:
V-VI
.
Comments

Downloads
Article Details
Volume & Issue : Vol 4 No 11 (2017)
Page No.: 1760-1774
Published on: 2017-11-29
Citations
Copyrights & License
This work is licensed under a Creative Commons Attribution 4.0 International License.
Search Panel
- HTML viewed - 15405 times
- Download PDF downloaded - 3191 times
- View Article downloaded - 6 times
