

Copyrights: Hieu Liem Pham, Phuc Van Pham, 2019. License: This work is licensed under a Creative Commons Attribution 4.0 International License.
Abstract
Introduction: The senescence of stem cells is the primary reason that causes aging of stem cell-containing tissues. Some hypotheses have suggested that high glucose concentration in diabetic patients is the main factor that causes senescence of cells in those patients. This study aimed to evaluate the effects of high glucose concentrations on the senescence of adipose-derived stem cells (ADSCs).
Methods: ADSCs were isolated and expanded from human adipose tissues. They were characterized and confirmed as mesenchymal stem cells (MSCs) by expression of surface markers, their shape, and in vitro differentiation potential. They were then cultured in 3 different media- that contained 17.5 mM, 35 mM, or 55 mM of D-glucose. The senescent status of ADSCs was recorded by the expression of the enzyme beta-galactosidase, cell proliferation, and doubling time. Real-time RT-PCR was used to evaluate the expression of p16, p21, p53 and mTOR.
Results: The results showed that high glucose concentrations (35 mM and 55 mM) in the culture medium induced senescence of human ADSCs. The ADSCs could progress to the senescent status quicker than those cultured in the lower glucose-containing medium (17.5 mM). The senescent state was related to the up-regulation of p16 and mTOR genes.
Conclusion: These results suggest that high glucose in culture medium can trigger the expression of p16 and mTOR genes which cause early senescence in ADSCs. Therefore, ADSCs should be cultured in low glucose culture medium, or normal glucose concentration, to extend their life in vitro as well as in vivo.
Introduction
Adipose-derived stem cells (ADSCs) are one kind of mesenchymal stem cells (MSCs) that has been most widely used in the clinic in recent years. ADSCs have been transplanted in patients to treat a variety of diseases, such as knee osteoarthritis, Crohn’s disease, diabetes mellitus type 1, and chronic obstructive pulmonary disease1,2,3,4 … In recent years, off-the-shelf ADSCs have been developed to treat diseases like ischemic heart disease/ heart failure 5, Crohn’s disease6 … Therefore, understanding optimal long-term in vitro expansion of ADSCs is important to yield adequate numbers of stem cells for laboratory and clinical applications. However, one major issue related to in vitro expansion of ADSCs is the aging of the cells during the expansion period.
The senescence of ADSCs during the in vitro expansion was studied and reported in some previous studies 7,8,9,10,11. In these studies, some authors suggested that glucose can have an effect on the proliferation of ADSCs12,13. Indeed, glucose is an essential ingredient of the culture medium to provide energy for cell activities. In the culture medium, glucose usually is added at a concentration from 1 g/L (5.5 mM) to 10 g/L (55 mM). Many classical media, such as CMRL-1066 Medium, Fischer's Medium, Medium 199, and Minimum Essential Medium Eagle (EMEM), are supplemented with approximately 5.5 mM D-glucose, which approximates normal blood sugar levels in vivo. Some other classic media contain higher concentration of glucose; for instance, DMEM/Ham's Nutrient Mixture F-12 (50:50) contains 17.5 mM of D-glucose, DMEM (Hi), GMEM and IMDM all contain 25 mM levels of D-glucose, and Serum-free and Protein-Free Hybridoma Media contain 22.6 and 28.9 mM D-glucose, respectively.
This study aimed to evaluate the effects of high glucose concentration in culture medium on the cellular senescence of human ADSCs.
Materials-Methods
Isolation of ADSCs
The adipose tissues were collected from the donors upon consent (signed forms). The adipose tissues were collected by vacuum-assisted adipose tissue suction technique for aesthetics. The adipose tissues were suspended in the transferring medium (Regenemedlab, HCMC, VN), and transferred to the laboratory under cool temperature condition. Once at the laboratory, adipose tissues were used to extract stromal vascular fraction (SVF) using the Cell Extraction Kit (Regenemedlab, HCMC, VN), according to the manufacturer’s guidelines. Briefly, adipose tissues were washed twice with washing buffer, and then mixed with the enzyme (SuperDigest) before placement in the extractor kit. The mixture (of adipose tissues and enzymes) was mixed thoroughly in the extractor for 15 min. Finally, the mixture was centrifuged for 35,000 rpm for 15 min to collect the SVF at the bottom of the centrifuge tubes.
SVFs were re-suspended in the ADSCCult I primary culture medium (Regenemedlab, HCMC, VN) with 107 cells per mL, plated in T75 flasks, and placed in an incubator (37oC, 5% CO2). After 5 days, the medium was replenished with fresh medium. When the cells reached approximately 75% confluence on the surface of the flask, the cells were deattached by De-attachment solution (Regenmedlab, HCMC, VN), and sub-cultured for continuous expansion in the culture medium (ADSCCult I, Regenemedlab, HCMC, VN). The ADSC candidates were sub-cultured to the 5th passage (or 10th passage) before they were used in further experiments.
Characterization of ADSCs
ADSC candidates were confirmed and characterized as ADSCs by the following assays:
Immunophenotyping by flow cytometry
Cell markers were analyzed following a previously published protocol14. Briefly, cells were washed twice in PBS containing 1% bovine serum albumin (Sigma-Aldrich, St. Louis, MO, USA). The cells were then stained with anti-CD14-FITC, anti-CD34-FITC, anti-CD44-PE, anti-CD45-FITC, anti-CD73-FITC, anti-CD90-PE, anti-CD105-FITC, or anti-HLA-DR-FITC antibody (all antibodies were purchased from BD Biosciences, San Jose, CA, USA). Stained cells were analyzed by a FACSCalibur flow cytometer (BD Biosciences). Isotype controls were used in all analyses.
In vitro differentiation
For differentiation into adipogenic cells, MSCs were differentiated as previously described 14. Briefly, cells from the 5th passage were plated at a density of 104 cells/well in 24-well plates. When cells reached 70% confluency, they were cultured for 21 days in DMEM/F12 containing 0.5 mM 3-isobutyl-1-methylxanthine, 1 nM dexamethasone, 0.1 mM indomethacin, and 10% FBS (all reagents were purchased from Thermo-Fisher). Adipogenic differentiation was evaluated by observing lipid droplets in cells; cells were stained with Oil Red and examined under a fluorescent microscope.
For differentiation into osteogenic cells, MSCs were plated at a density of 104 cells/well in 24-well plates. At 70% confluence, cells were cultured for 21 days in DMEM/F12 containing 10% FBS, 10-7 M dexamethasone, 50 μM ascorbic acid-2 phosphate, and 10 mM β-glycerol phosphate (all reagents were purchased from Thermo-Fisher). Osteogenic differentiation was confirmed by Alizarin red staining, as visualized under a fluorescent microscope.
For differentiation into chondroblasts, MSCs were differentiated according to the guidelines of the Chondrogenesis kit (Thermo Fisher, Waltham, MA, USA).
High-glucose concentration treatment
To evaluate the effects of glucose on the senescence of ADSCs, ADSCs at the 5th passage were cultured in 3 different glucose media with: 17.5 mM (M1; ADSCCult I medium), 35 mM (M2; ADSCCult I medium supplemented with glucose to a final concentration of 35 mM), and 55 mM (M3 ADSCCult I medium supplemented with glucose to a final concentration of 55 mM).
Effects of glucose on the proliferation of ADSCs
ADSCs were seeded on an E-plate 96 (1,000 cells/well) and cultured for 12 h in ADSCCult I medium before replenishment with M1, M2, or M3 medium. After 12 h, the medium was replaced with fresh medium of M1, M2, or M3. The cells were monitored for their proliferation during 72 h without any medium change. Cell index values were recorded every 3 h (up to 72 h) using the Real-Time Cell Analyzer xCELLigence System (Roche-Applied Science, Indianapolis, IN, USA). The doubling time values were calculated based on the proliferation curves.
Determination of the percentage of aged ADSCs by flow cytometry
The senescent status of ADSCs was evaluated basing on the Senescence Assay kit (measures beta-galactosidase; obtained from Abcam, Cambridge, UK). ADSCs cultured in M1, M2, and M3 were treated in those media for 72 h before they were assayed to record the senescent status. After 72 h, cells grown under those 3 glucose conditions were replenished with fresh media supplemented with Senescence dye (at 1.5 μL of Senescence dye per 500 μL of medium), then incubated for 2 h at 37oC, 5% CO2.
After incubation, the cells were washed with washing buffer. Then, the adherent cells were collected by De-attachment Solution. These cells were re-suspended in Facsfluid olution for flow cytometry analysis using the BD FASCalibur machine (BD Biosciences) with CellQuest Pro software. The positive signal was recorded at FL-1 channel for the senescence dye. This assay was performed in triplicate, and the mean values were calculated and compared between groups.
Evaluation of the p16, p21, 53 and mTOR gene expression by real-time RT-PCR
The expression of some genes related to the senescence was evaluated by real-time RT-PCR. ADSCs at the 10th passage were cultured in the M1, M2 or M3 medium, and after 72h, were collected to isolate total RNA using the Purelink RNA Mini Kit (Thermo Fisher Scientific, Waltham, MA, USA). ADSCs were collected by De-attachment Solution (Regenemedlab). Next, the cell pellet was lysed by Lysis buffer with 2-mercaptoethanol. The lysate was centrifuged at 12,000 g for 2 min, and then the lysate was passed through a 18-20 G syringe for 5-10 times before centrifugation at 26,000 g for 5 min to collect the supernatant. Finally, the supernatant was used to purify the RNA through columns. The purified RNA was assayed in real-time RT-PCR. We performed quantitative PCR with SYBR Green on a LightCycler® 480 system (480 Real-Time PCR System; Roche, Indianapolis, IN, USA).
| Genes | Forward (5’-3’) | Reverse (5’-3’) |
| p16 ink4a | CTTCCCCCACTACCGTAAAT | TGCTCACTCCAGAAAACTCC |
| p21 | AAACTTTGGAGTCCCCTCAC | AAAGGCTCAACACTGAGACG |
| p53 | TCTACCTCCCGCCATAAAA | CTCCTCCCCACAACAAAAC |
| mTOR | CTGGGACTCAAATGTGTGCAGTTC | GAACAATAGGGTGAATGATCCGGG |
| GAPDH | ACCACAGTCCATGCCATCAC | TCCACCACCCTGTTGCTGTA |
Statistical analysis
The data were analyzed for statistical significance using GraphPad Prism (GraphPad Software, Inc., La Jolla, CA, USA). Data were presented as mean ± SEM. When applicable, Student's unpaired t-test and one-way ANOVA test were used to determine significance; p<0.05 was considered to be statistically significant.
Results
ADSCs were successfully isolated from the adipose tissues
The ADSCs were successfully isolated and expanded as the published results 15. ADSC exhibited fibroblast-like shape. They were positive for common markers of MSCs, including CD44 (98.21%), CD73 (99.1%), and CD90 (100%); they were negative/low for hematopoietic cell markers, such as CD14 (2.67%), CD45 (1.31%), and HLA-DR (3.14%). The cells also passed the in vitro differentiation assays - which showed successful differentiation into adipocytes, osteoblasts, and chondroblasts.
The proliferation of ADSCs significantly reduced when the concentration of glucose increased after 5 days
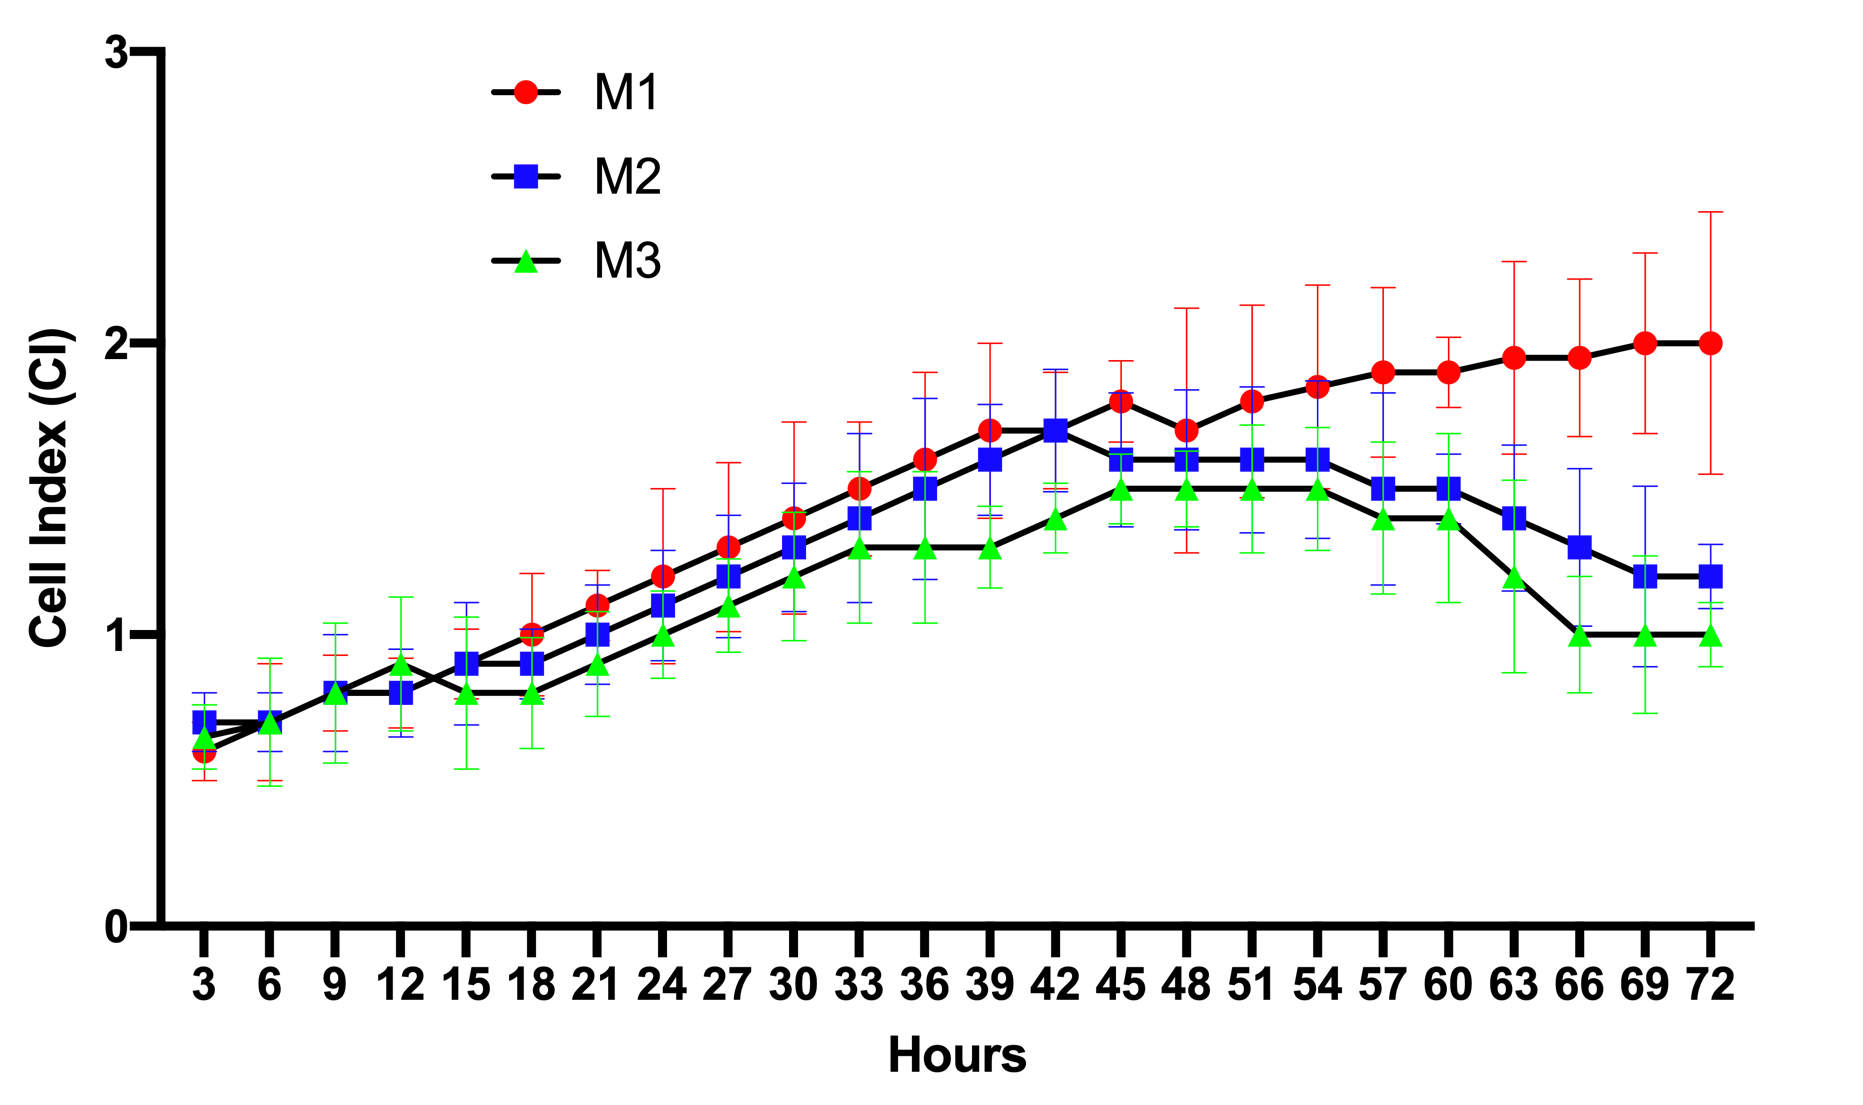
The results of the proliferation curves of ADSCs cultured in M1, M2, and M3 media are presented in Figure 1. The data show that from 0-12 h, the proliferation curve of cells in M1, M2, or M3 media were not significantly different from each other. This meant that in this initial stage, the cells started to adhere to the surface of the E-plates, causing an increase in the electrical resistance. From 12-45 h, the ADSCs in the M1, M2, and M3 media gradually grew in number. There were slight differences in the proliferation rates among M1, M2, and M3. The proliferation rate for M1 was the highest, while the rate for M2 was the lowest.
However, clear difference in proliferation rates were recorded from 45-72 h. ADSCs cultured in M1 grew well such that the proliferation rate showed a continuous gain. However, the proliferation rates of ADSCs in M2, as well as M3, showed a decrease, starting at the 45 h time point. Although there was no significant difference between the cell proliferation rate of M2 versus that of M3, it seemed that the proliferation rate of ADSCs in M3 showed a stronger decline (p>0.05).

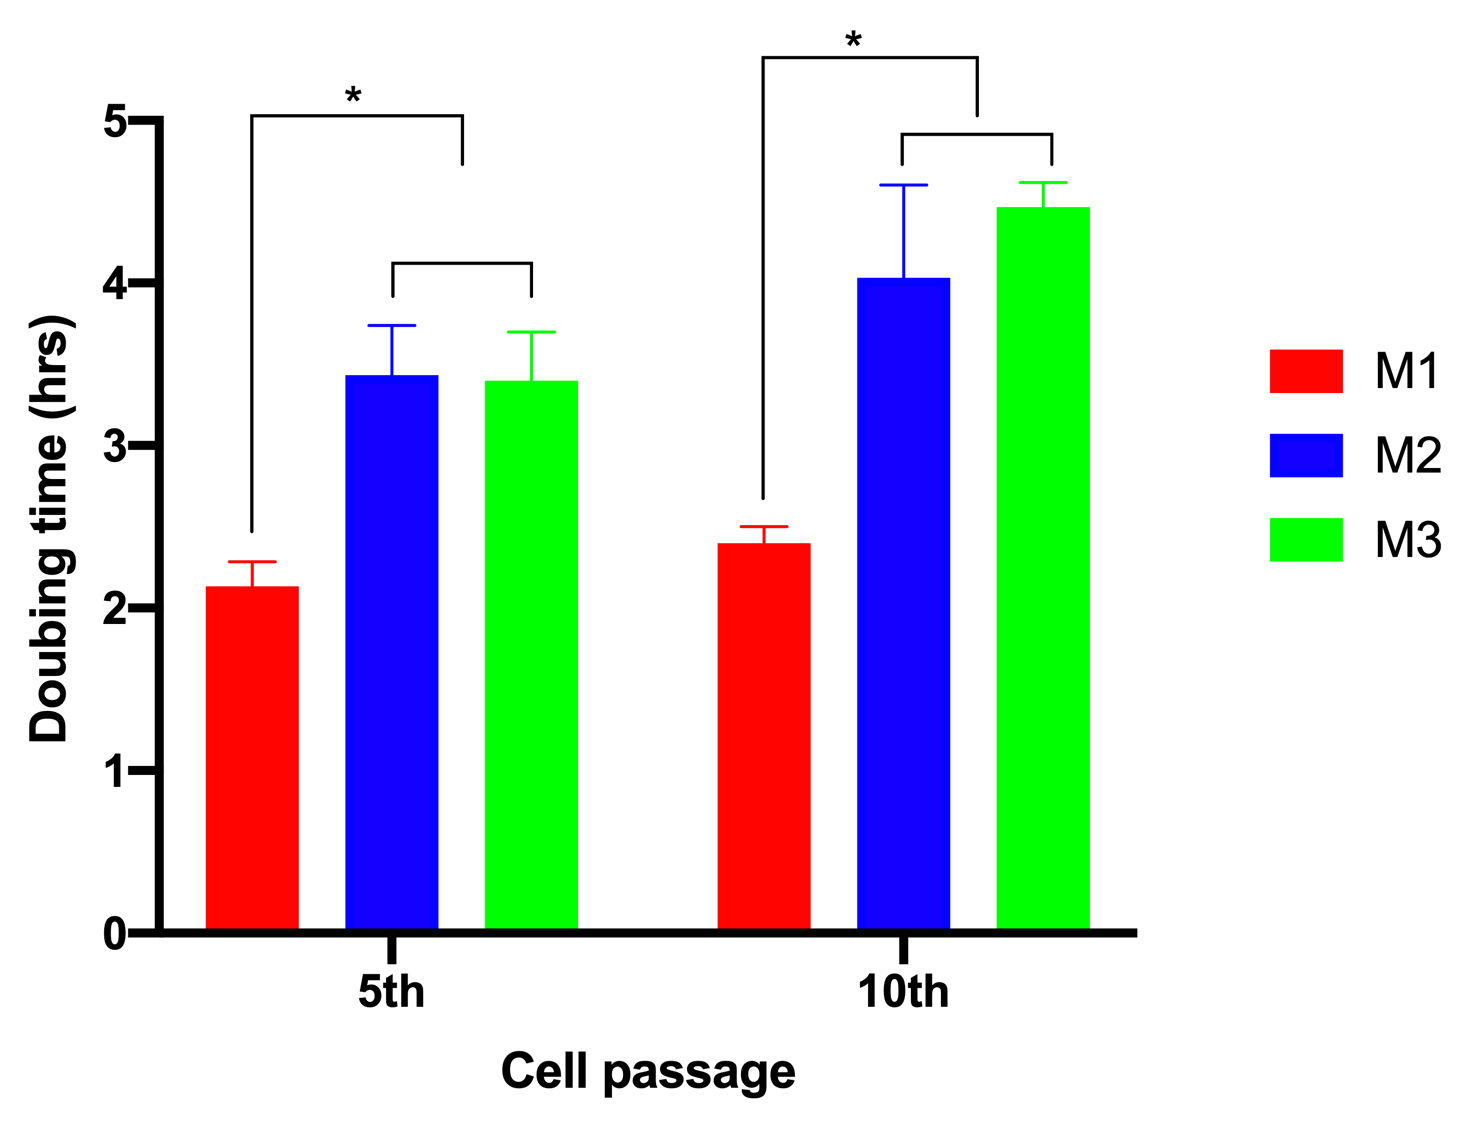
To evaluate the effects of glucose on cell proliferation, we analyzed cell doubling time. The results showed that when ADSCs were cultured in M1, the cell doubling time was 2.13±0.15 h and 2.4±0.1 h for the 5th and 10th passages, respectively. However, these values significantly increased to 3.43±0.31 and 4.03±0.57 for the 5th and 10th passages, respectively, for ADSCs cultured in M2. The values were 3.4±0.3 h and 4.5± 0.15 h for the 5th and 10th passages, respectively, for ADSCs cultured in M3 (Figure 2).
The premature of ADSCs appeared in the high glucose medium
The senescence of ADSCs was evaluated by flow cytometry after culture in M1, M2, or M3 medium (Figure 3). There were significant differences in the senescence dye-positive cells among M1, M2, and M3, for both the 5th and 10th passage of ADSCs. In general, for the 10th passage of ADSCs, the percentage of positive cells was higher than that of the 5th passage ADSCs, in all media (M1, M2, and M3).
In the higher glucose concentration medium, the percentage of positive cells was also higher than in the lower glucose concentration medium. As in Figure 3, at the 5th passage of ADSCs, the rate of positive cells increased from 2±1% in M1 to 9.33±3.05% in M2 and 38.33±7.64% in M3 (p<0.05). At the 10th passage of ADSCs, the percentages were 7±2% in M1, 26.67±5.77% in M2, and 60±10% in M3 (p<0.05).

The p16, p21, p53 and mTOR gene expression significantly increased in the high glucose medium
The expression of p16, p21, p53 and mTOR was evaluated in ADSCs (at the 10th passage) after culture in M1, M2, and M3 medium. Gene expression level was normalized to GAPDH (set as 100%). The results showed that all investigated genes, including p16, p21, p53 and mTOR, was strongly expressed when ADSCs were cultured in M2 and M3 (p<0.05). The data also show that there was a significantly difference in the expression level of these genes when ADSCs were cultured in M1, as compared to M2 or M3 (p<0.05) (Figure 4).
The expression levels of these genes were also different for ADSCs cultured in M2 versus M3 (p<0.05). However, only two genes (p16 and mTOR) were increased in M3 compared to M2. Although the expression levels of p21 and p53 were higher in M3 versus M2, the differences were non-significant (p>0.05) (Figure 4).

Discussion
Stem cell therapy, including ADSC transplantation, is now considered as one of the most promising therapies for some degenerative diseases. Indeed, MSCs in general, as well as ADSCs specifically, can exert therapeutic effects via at least three mechanisms: 1) homing and differentiation to the specialized cells, 2) immune modulation, and 3) production of cytokines and growth factors (that can affect the healing). In light of these functions, the in vitro expansion of ADSCs has become a major interest of study in order to optimize the long-term production of adequate numbers of stem cells for use in clinical applications. However, the natural senescence of ADSCs after the long-term in vitro expansion has been the most difficult part of ADSC production for application. Our preliminary study herein has demonstrated that glucose can be a predominant factor which trigger premature senescence of ADSCs.
Glucose is an essential source of energy for cells as well as stem cells. This energy serves in protein and lipid synthesis. When glucose is available in culture medium, it enters the stem cells through glucose transporter facilitators (GLUT) and glucose transporters. However, high concentration of glucose can cause toxicity of cells. In some previous studies, high glucose concentration was shown to impair β-cell function and subsequently induce apoptosis16, affect pancreatic β-cells, lead to oxidative damage in the body (such as eyes, kidneys, nerves, and blood vessels)17, and induce cellular senescence18,19.
In this study, we provide more evidence on the effects of high glucose concentration in inducing senescence. Our results confirmed that at high glucose concentration (35 mM or 55 mM), ADSCs proceeded to the senescent phase. Indeed, at the 5th and 10th passages, ADSCs cultured in the high glucose concentration media displayed characteristics of senescent cells.
Firstly, the proliferation rates of the ADSCs grown under the high concentrations were clearly decreased. Reduction of proliferation rate was measured through cell proliferation curves and doubling time. Unlike ADSCs cultured in lower glucose concentration (17.5 mM), ADSCs cultured in high concentrations (35 mM and 55 mM) rapidly underwent the aging phase after 45 hours of culture, while ADSCs cultured in 17.5 mM glucose continued to proliferate out to 72 hours. Moreover, the doubling time of ADSCs in the higher glucose concentrations was also more extended.
Secondly, the beta-galactosidase assay confirmed the above observations. Beta-galactosidase is an enzyme that catalyzes the hydrolysis of beta-galactosides into monosaccharides through the breaking of the glycosidic bond. The expression of beta-galactosidase is associated with senescence and, thus, is used as a biomarker for cellular senescence 20,21.
In 1995, the study by Dimri et al. (1995) showed that only cells in senescence state stained positive for beta-galactosidase. Since then, the beta-galactosidase assay has been used as an important test for determining senescence22,23,24. The results of study herein showed that the percentage of cells positive for beta-galactosidase staining was significantly increased when ADSCs were cultured in higher glucose concentrations (35 mM and 55 mM), as compared to ADSCs cultured in lower (17.5 mM) glucose concentration. More interestingly, at 55 mM glucose concentration, the percentage of positive cells was recorded to be higher than at 35 mM. These observations suggest that high glucose (particularly 55 mM) can trigger cellular senescence in ADSCs.
Some published studies have also showed that reducing glucose can stimulate cell proliferation, and that high glucose can enhance apoptosis in a rat model 18. Other studies have also found that beta-cell mass is reduced in diabetic patients and apoptosis is increased25,26,27. Stolzing et al. evaluated the effects of high glucose on the senescence of bone marrow MSCs; they also showed that high glucose medium had an adverse impact on colony formation and differentiation of these cells 28. In the primary evaluation of glucose on ADSCs, Liang et al. showed that low glucose is a positive factor that affects the survival and biological behaviors of ADSC29. In accordance with Liang et al., Elseberg et al. also showed data to suggest that the concentration of glucose in cell culture medium can affect MSC proliferation30.
In the subsequent assay, we attempted to determine the mechanisms of aging in ADSCs cultured in high glucose-containing medium. Gene expression was evaluated for several genes related to aging, and the analysis showed that there were significant increases of some genes, such as p16, p21, p53 and mTOR. These results suggested that glucose can induce or trigger the expression of these genes. However, upon further analysis after increasing the glucose concentration to 50 mM, we did not find continual increase expression of p21 or p53, but only increased expression of p16 and mTOR. These preliminary observations suggest that the expression of the 2 genes, p16 and mTOR, may depend on the glucose concentration in the culture medium. This observation is similar to findings from a previous publication which suggested that mTOR is associated with stem cell aging12,31,32,33; in that study by Zhang et al. (2017), the authors showed that high glucose concentration can induce the expression of mTOR that cause the senescence of bone marrow MSCs in a rat model12.
In other studies, other mechanisms of senescence induced by high glucose concentration were detected. For example, Kim et al. showed miR-486-5p up-regulation in ADSCs cultured in high glucose-containing medium34.
Conclusion
In vitro expansion of ADSCs is an essential step to harvest enough stem cells for in vitro assays and also clinical application. However, a major obstacle in stem cell manufacturing is stem cell aging after long-term expansion. This study showed that glucose concentrations in culture medium can affect senescence of ADSCs. At high concentrations (35 mM or 55 mM), glucose can trigger the expression of p16, p21, p53 and mTOR (particularly of p16 and mTOR), which can promote the early senescent phenotype in ADSCs.
Our study results suggest that fewer ADSCs may undergo senescence from the use of low glucose concentration in culture medium. Thus, ADSCs should be cultured in low glucose culture medium, or normal glucose concentration, to optimize their proliferation in vitro as well as in vivo. Moreover, further investigation of suitable glucose concentration for ADSC expansion will be essential for understanding and exploring optimal ADSC expansion for clinical applications.
Abbreviations
ADSC: Adipose derived stem cell
h: hour
MSC: Mesenchymal stem cell
Competing Interests
Authors declare no conflict of interest.
Authors' Contributions
LHP performed the AT-MSCs preparation: isolation and expansion, draft the manuscript; performed the in vitro differentiation and characterization; PVP collected data, analysed the data; performed the senescence assays. All authors read and approved the final manuscript for publication.
Acknowledgments
This research was funded by Fostering Innovation through Research, Science and Technology, Viet Nam via project 15/FIRST/2a/SCI.
References
-
Wang
M.,
Yuan
Q.,
Xie
L.,
Mesenchymal stem cell-based immunomodulation: properties and clinical application. Stem cells international.
2018;
2018
.
View Article Google Scholar -
Antoniou
K.M.,
Karagiannis
K.,
Tsitoura
E.,
Bibaki
E.,
Lasithiotaki
I.,
Proklou
A.,
Clinical applications of mesenchymal stem cells in chronic lung diseases. Biomed Rep.
2018;
8
(4)
:
314-8
.
View Article PubMed Google Scholar -
McCarthy
M.E.,
Brown
T.A.,
Bukowska
J.,
Bunnell
B.A.,
Frazier
T.,
Wu
X.,
Therapeutic Applications for Adipose-Derived Stem Cells in Wound Healing and Tissue Engineering. Curr Stem Cell Rep.
2018;
4
(2)
:
127-37
.
View Article Google Scholar -
Sukho
P.,
Cohen
A.,
Hesselink
J.W.,
Kirpensteijn
J.,
Verseijden
F.,
Bastiaansen-Jenniskens
Y.M.,
Adipose tissue-derived stem cell sheet application for tissue healing in vivo: a systematic review. Tissue Eng Part B Rev.
2018;
24
(1)
:
37-52
.
View Article PubMed Google Scholar -
Kastrup
J.,
Haack-S∅rensen
M.,
Juhl
M.,
Harary S∅ndergaard
R.,
Follin
B.,
Drozd Lund
L.,
Cryopreserved Off-the-Shelf Allogeneic Adipose-Derived Stromal Cells for Therapy in Patients with Ischemic Heart Disease and Heart Failure-A Safety Study. Stem Cells Transl Med.
2017;
6
(11)
:
1963-71
.
View Article PubMed Google Scholar -
Scott
L.J.,
Darvadstrocel: A Review in Treatment-Refractory Complex Perianal Fistulas in Crohn's Disease. BioDrugs.
2018;
32
(6)
:
627-34
.
View Article PubMed Google Scholar -
Gu
Y.,
Li
T.,
Ding
Y.,
Sun
L.,
Tu
T.,
Zhu
W.,
Changes in mesenchymal stem cells following long-term culture in vitro. Mol Med Rep.
2016;
13
(6)
:
5207-15
.
View Article PubMed Google Scholar -
Jiang
T.,
Xu
G.,
Wang
Q.,
Yang
L.,
Zheng
L.,
Zhao
J.,
In vitro expansion impaired the stemness of early passage mesenchymal stem cells for treatment of cartilage defects. Cell Death Dis.
2017;
8
(6)
:
e2851
.
View Article PubMed Google Scholar -
Yang
Y.K.,
Ogando
C.R.,
Wang See
C.,
Chang
T.Y.,
Barabino
G.A.,
Changes in phenotype and differentiation potential of human mesenchymal stem cells aging in vitro. Stem Cell Res Ther.
2018;
9
(1)
:
131
.
View Article PubMed Google Scholar -
Truong
N.C.,
Bui
K.H.,
Pham
P. Van,
Characterization of Senescence of Human Adipose-Derived Stem Cells After Long-Term Expansion. Adv Exp Med Biol.
2018
.
View Article PubMed Google Scholar -
Safwani
W.K.,
Makpol
S.,
Sathapan
S.,
Chua
K.H.,
The impact of long-term in vitro expansion on the senescence-associated markers of human adipose-derived stem cells. Appl Biochem Biotechnol.
2012;
166
(8)
:
2101-13
.
View Article PubMed Google Scholar -
Zhang
D.,
Lu
H.,
Chen
Z.,
Wang
Y.,
Lin
J.,
Xu
S.,
High glucose induces the aging of mesenchymal stem cells via Akt/mTOR signaling. Mol Med Rep.
2017;
16
(2)
:
1685-90
.
View Article PubMed Google Scholar -
Chang
T.C.,
Hsu
M.F.,
Wu
K.K.,
High glucose induces bone marrow-derived mesenchymal stem cell senescence by upregulating autophagy. PLoS One.
2015;
10
(5)
:
e0126537
.
View Article PubMed Google Scholar -
Phuc
P.,
Ngoc
V.,
Nhan
P.,
Dung
L.,
Nhat
T.,
Nhung
T.,
Good manufacturing practice-compliant isolation and culture of human adipose-derived stem cells. Biomed Res Ther.
2016;
1
(04)
:
133-41
.
-
Pham
L.H.,
Vu
N.B.,
Van Pham
P.,
The subpopulation of CD105 negative mesenchymal stem cells show strong immunomodulation capacity compared to CD105 positive mesenchymal stem cells. Biomed Res Ther.
2019;
6
(4)
:
3131-40
.
View Article Google Scholar -
Liu
J.,
Wu
Y.,
Wang
B.,
Yuan
X.,
Fang
B.,
High levels of glucose induced the caspase-3/PARP signaling pathway, leading to apoptosis in human periodontal ligament fibroblasts. Cell Biochem Biophys.
2013;
66
(2)
:
229-37
.
View Article PubMed Google Scholar -
Robertson
R.P.,
Harmon
J.S.,
Diabetes, glucose toxicity, and oxidative stress: A case of double jeopardy for the pancreatic islet β cell. Free Radic Biol Med.
2006;
41
(2)
:
177-84
.
View Article PubMed Google Scholar -
Stolzing
A.,
Coleman
N.,
Scutt
A.,
Glucose-induced replicative senescence in mesenchymal stem cells. Rejuvenation Res.
2006;
9
(1)
:
31-5
.
View Article PubMed Google Scholar -
Chang
J.,
Li
Y.,
Huang
Y.,
Lam
K.S.,
Hoo
R.L.,
Wong
W.T.,
Adiponectin prevents diabetic premature senescence of endothelial progenitor cells and promotes endothelial repair by suppressing the p38 MAP kinase/p16INK4A signaling pathway. Diabetes.
2010;
59
(11)
:
2949-59
.
View Article PubMed Google Scholar -
Hall
B.M.,
Balan
V.,
Gleiberman
A.S.,
Strom
E.,
Krasnov
P.,
Virtuoso
L.P.,
Aging of mice is associated with p16(Ink4a)- and β-galactosidase-positive macrophage accumulation that can be induced in young mice by senescent cells. Aging (Albany NY).
2016;
8
(7)
:
1294-315
.
View Article PubMed Google Scholar -
Hall
B.M.,
Balan
V.,
Gleiberman
A.S.,
Strom
E.,
Krasnov
P.,
Virtuoso
L.P.,
p16(Ink4a) and senescence-associated β-galactosidase can be induced in macrophages as part of a reversible response to physiological stimuli. Aging (Albany NY).
2017;
9
(8)
:
1867-84
.
View Article PubMed Google Scholar -
Bassaneze
V.,
Miyakawa
A.A.,
Krieger
J.E.,
A quantitative chemiluminescent method for studying replicative and stress-induced premature senescence in cell cultures. Anal Biochem.
2008;
372
(2)
:
198-203
.
View Article PubMed Google Scholar -
Gary
R.K.,
Kindell
S.M.,
Quantitative assay of senescence-associated β-galactosidase activity in mammalian cell extracts. Anal Biochem.
2005;
343
(2)
:
329-34
.
View Article PubMed Google Scholar -
Itahana
K.,
Campisi
J.,
Dimri
G.P.,
Biological AgingSpringer 2007.
Google Scholar -
Butler
A.E.,
Janson
J.,
Bonner-Weir
S.,
Ritzel
R.,
Rizza
R.A.,
Butler
P.C.,
β-cell deficit and increased β-cell apoptosis in humans with type 2 diabetes. Diabetes.
2003;
52
(1)
:
102-10
.
View Article PubMed Google Scholar -
Cho
J.H.,
Lee
I.K.,
Yoon
K.H.,
Ko
S.H.,
Suh
S.H.,
Lee
J.M.,
Selective beta-Cell Loss and alpha-Cell Expansion in Islets of Type 2 Diabetic Patients. The Journal of Korean Diabetes Association..
2001;
25
(2)
:
164-77
.
-
Sakuraba
H.,
Mizukami
H.,
Yagihashi
N.,
Wada
R.,
Hanyu
C.,
Yagihashi
S.,
Reduced beta-cell mass and expression of oxidative stress-related DNA damage in the islet of Japanese Type II diabetic patients. Diabetologia.
2002;
45
(1)
:
85-96
.
View Article PubMed Google Scholar -
Stolzing
A.,
Bauer
E.,
Scutt
A.,
Suspension cultures of bone-marrow-derived mesenchymal stem cells: effects of donor age and glucose level. Stem Cells Dev.
2012;
21
(14)
:
2718-23
.
View Article PubMed Google Scholar -
Liang
C.,
Li
H.,
Tao
Y.,
Zhou
X.,
Li
F.,
Chen
G.,
Responses of human adipose-derived mesenchymal stem cells to chemical microenvironment of the intervertebral disc. J Transl Med.
2012;
10
(1)
:
49
.
View Article PubMed Google Scholar -
Elseberg
C.L.,
Leber
J.,
Salzig
D.,
Wallrapp
C.,
Kassem
M.,
Kraume
M.,
Microcarrier-based expansion process for hMSCs with high vitality and undifferentiated characteristics. Int J Artif Organs.
2012;
35
(2)
:
93-107
.
View Article PubMed Google Scholar -
Liu
S.,
Liu
S.,
Wang
X.,
Zhou
J.,
Cao
Y.,
Wang
F.,
The PI3K-Akt pathway inhibits senescence and promotes self-renewal of human skin-derived precursors in vitro. Aging Cell.
2011;
10
(4)
:
661-74
.
View Article PubMed Google Scholar -
Iglesias-Bartolome
R.,
Patel
V.,
Cotrim
A.,
Leelahavanichkul
K.,
Molinolo
A.A.,
Mitchell
J.B.,
mTOR inhibition prevents epithelial stem cell senescence and protects from radiation-induced mucositis. Cell Stem Cell.
2012;
11
(3)
:
401-14
.
View Article PubMed Google Scholar -
Zhang
D.,
Yan
B.,
Yu
S.,
Zhang
C.,
Wang
B.,
Wang
Y.,
Coenzyme Q10 inhibits the aging of mesenchymal stem cells induced by D-galactose through Akt/mTOR signaling. Oxidative medicine and cellular longevity.
2015;
2015
.
-
Kim
Y.J.,
Hwang
S.H.,
Lee
S.Y.,
Shin
K.K.,
Cho
H.H.,
Bae
Y.C.,
miR-486-5p induces replicative senescence of human adipose tissue-derived mesenchymal stem cells and its expression is controlled by high glucose. Stem Cells Dev.
2012;
21
(10)
:
1749-60
.
View Article PubMed Google Scholar
Comments
Downloads
Article Details
Volume & Issue : Vol 6 No 6 (2019)
Page No.: 3213-3221
Published on: 2019-06-18
Citations
Copyrights & License
This work is licensed under a Creative Commons Attribution 4.0 International License.
Search Panel
- HTML viewed - 8999 times
- Download PDF downloaded - 2217 times
- View Article downloaded - 0 times
