

Copyrights: Ying-Hui Teh, Xuan-Yi Sim, Yan-Fen Lee, Waqas Ahmad, Vikneswaran Murugaiyah, Baharudin Ibrahim, Mohd Nazri Ismail, Peter Greimel, Lay-Harn Gam, 2020. License: This work is licensed under a Creative Commons Attribution 4.0 International License.
Abstract
Background: Type 2 Diabetes is the most common form of diabetes mellitus, accounting for 90% of all types of diabetes. Diet is one of the important factors affecting the progression of the disease.
Methods: In this study, we used urinary protein profile to evaluate the progression of pre-diabetic to diabetic state. Urinary protein profile of pre-diabetic rats with various diet conditions and with or without metformin treatment were compared to those of healthy rats and diabetic rats.
Results: It was shown that there were distinct bands that could differentiate the healthy rats from the diabetic ones, namely the protein bands at MW 350 kDa, 280 kDa and 85 kDa (for healthy rats), and protein bands at MW 170 kDa, 51 kDa and 46 kDa (for diabetic rats). In addition, the differentially excreted proteins at MW 62 kDa and 25 kDa (between healthy and diabetic rats) could also be used as indicators. Using the unique band indicators, the pre-diabetic urinary profile was shown to be similar to that of healthy rats. However, by using the differential protein indicators, the band intensity of the 62 kDa, 25 kDa and 17 kDa bands of pre-diabetic rats, with normal diet and metformin treatment, was more similar to that of the healthy rats with normal diet. However, the profile of pre-diabetic rats with high fat diet (with or without metformin treatment) and of pre-diabetic rats (with normal diet without metformin treatment) were more similar to that of diabetic rats.
Conclusion: Using this protein profiling comparison method, it was demonstrated that early metformin treatment and controlled diet intake are important in delaying the progression of the pre-diabetic to diabetic state.
Introduction
Diabetes is one of the most common non-communicable diseases globally. It affects 451 million people worldwide and is estimated to incrementally reach 693 million in the year 20451. Type 2 Diabetes Mellitus (T2DM) is caused by insulin resistance or insulin deficiency which leads to accumulation of blood glucose (in the range beyond 7.0 mmol/L). Meanwhile pre-diabetes has elevated fasting blood glucose levels in the range of 5.6 mmol/L to 7.0 mmol/L (diabetes threshold). Pre-diabetic patients with elevated blood glucose levels are at high risk to develop diabetes2.
Despite the fact that T2DM is due to aging or genetic inheritance, other circumstances, like obesity, smoking, alcohol, unhealthy lifestyle and diet, are the root causes of T2DM3. Diet is one of the common risk factors for T2DM. High-fat diet (HFD) could contribute to insulin insensitivity towards blood glucose and to impaired glucose tolerance. Moreover, fat intake exceeding 40% of total energy can lead to cell function abnormalities, such as reduction in insulin receptors, glucose transport and metabolism; as well, high-fat intake can reduce the function of energy storage in liver and muscle cells4. Besides, HFD has been reported to cause lipotoxicity in several organs, namely heart, skeletal muscle, liver, pancreas and kidneys5. Excessive adipose tissue can lead to endoplasmic reticulum stress and indirectly result in decreased insulin secretions4. On the contrary, low-carbohydrate diet and low-fat diet are effective to reduce glycosylated hemoglobin A1C (HbA1C), a form of hemoglobin that binds to glucose6.
Prolonged hyperglycemia in patient with diabetes and pre-diabetes can increase the risk of macrovascular complications (such as cardiovascular disease) and microvascular complications (e.g. retinopathy, neuropathy and nephropathy)7, 3. In terms of diabetic nephropathy (DN), which is marked by excessive protein (>500 mg per 24 h) excreted from the body and also decreased glomerular filtration rate (eGFR) of <60 mL per 1.73 m2 area8.
It is caused by hyperglycemia that leads to abnormality of intracellular metabolism, formation of advanced glycation end-products (AGEs), and formation of reactive oxygen species (ROS), as well as glomerular hyperfiltration and hypertension. These conditions will result in macrophage infiltration into renal tissue that will lead to development of DN and then progression to end-stage renal disease9. Furthermore, patients with nephropathy complications will excrete a high quantity of albumin, termed macroalbuminuria (>300 mg per 24 h) in urine. However, this phase usually will occur after 10 to 15 years of diabetes. Indeed, there have been studies that have suggested that albuminuria is not a suitable marker for the diagnosis of DN risk as it lacks specificity and sensitivity10.
Hence, other urinary protein markers for predicting diabetes and pre-diabetes have been identified. For example, elevated urinary monocyte chemoattractant protein-1 (uMCP-1) and vitamin D-binding protein were seen in DN patients (10). In addition, other biomarkers like kidney injury molecule 1 (u-KIM-1), which was found in urine, have been proposed to be risk factors for decline of eGFR11.
Nowadays, diabetes management for patients are costly but well-established1. Nevertheless, change of lifestyle by diabetes patients should be emphasized in order to have a better maintenance of blood glucose levels3. In this study, we aimed to analyze the change in urinary protein profile of diabetic rats by the effects of a high fat diet (HFD). It is hoped that relevant proteins can be identified as potential biomarkers to indicate progression of the disease.
Materials and Methods
Materials
Metformin tablets used in this study were purchased from Dynapharm (Malaysia). Ketamine was purchased from Troy Laboratories (Australia) and xylazine was obtained from Indian Immunological Limited (India). The rest of the chemicals were purchased from Sigma Aldrich (USA) and Bio-Rad (USA).
Animal studies
A total of 60 male adult rats (Sprague-Dawley) were obtained from the Animal Research Center and Service, Universiti Sains Malaysia (Penang, Malaysia). The rats were housed individually in cages under controlled environment at 22-24°C with 12 hours of light/dark cycle. All the rats were given a week for adaptation to the environment. The experimental procedures were approved by the Animal Ethics Committee of Universiti Sains Malaysia (USM/Animal Ethics Approval /2016/(717)). Table 1 shows the diets and treatments of each group of rats.
| Rat Groups | Condition | Diets and Treatments | Group Number |
|---|---|---|---|
| Control Groups | Non diabetic | ND | G1 |
| HFD | G4 | ||
| Experimental Groups | Diabetic | ND | G2 |
| ND + Metformin | G3 | ||
| HFD | G5 | ||
| HFD + Metformin | G6 | ||
| Pre-diabetic | ND | G7 | |
| ND + Metformin | G8 | ||
| HFD | G9 | ||
| HFD + Metformin | G10 |
Induction of Diabetes
Forty-eight of the 60 male rats were assigned to the experimental groups. Diabetes was induced in these rats by intraperitoneal injection (i.p.) of streptozotocin (STZ). The rats were put on fasting for 12 hours before the induction. After the fasting period, nicotinamide (NA) dissolved in normal saline was injected into the peritoneal cavity of rats at a dose of 110 mg/kg. After 15 minutes, STZ (dissolved in 0.1 M of sodium citrate dihydrate, pH 4.5) was administered by i.p. injection to the animals at a dose of 65 mg/kg. At the same time, the other 12 rats were assigned to the control (non-diabetic) group, and were injected with vehicle (saline and citric buffer). Animals from both control and experimental groups were monitored for 4 consecutive weeks.
Experimental Design
After 4 weeks of the monitoring period, the rats were sorted into 10 groups and were fed according to their diet plan for 6 weeks. Each group consisted of 6 rats (n=6). Non-induced rats from the control groups were divided into Group 1 (G1), which was fed with normal diet (ND), prepared by mixing the feed powder (Altromin, Germany) with water at ratio of 1:1, and into Group 4 (G4), which was fed with high fat diet (HFD), prepared by mixing 1:1 food powder to water ratio and 22.4% (v/w) of cooking oil. Meanwhile, the induced-rats from the experimental groups were divided into two groups based on their fasting blood glucose (FBG) level: diabetic group (FBG >7.0 mmol/L) and pre-diabetic group (FBG 5.6-6.9 mmol/L)10.
Diabetic rats were further assigned into Group 2 (G2), Group 3 (G3), Group 5 (G5) and Group 6 (G6), while pre-diabetic rats were subdivided into Group 7 (G7), Group 8 (G8), Group 9 (G9), and Group 10 (G10). Rats from G2 and G7 were fed with ND while rats from G3 and G8 were fed with ND and treated with metformin. Moreover, rats from G5 and G9 were fed with HFD, while rats from G6 and G10 were fed with HFD and received metformin treatment. Metformin drug was prepared by suspending metformin tablets in 1% carboxymethylcellulose and was fed orally to the rats twice a day- at a dosage of 250 mg/kg. Rats were given free access to food pellets (approximately 26 g per day) and water throughout the experiment.
Collection of Urine Samples
The rats were kept in metabolic cages overnight for urine collection. Five hundred µL of 10% (w/v) sodium azide was transferred into the urine collector prior to the collection for antifungal purpose. The urine of the rats was collected the next morning. The collected urine was aliquoted into 1.5 mL eppendorf tubes.
Urinary Protein Extraction
Urinary proteins were precipitated by ammonium sulfate salt precipitation, based on the procedure described by Wai Hoe, L. et al.12, with slight modifications. The protein precipitation was done at 45% of salt saturation by mixing ammonium sulphate salt with urine thoroughly for 1 minute and centrifuged (at 13000 rpm, 20 minutes, 4°C). The collected pellets were further reconstituted in TSE buffer (10 mM Tris, 1 mM EDTA and 1% (w/v) SDS).
Sodium Dodecyl Sulphate Polyacrylamide Gel (SDS-PAGE)
Protein concentration of each sample was determined by RC/DC protein assay (Bio-Rad), following the protocol provided by the manufacturer. Protein standard used was Bio-rad protein assay standard I, Bovine Gamma Globulin (BGG), at these concentrations: 1, 0.5, 0.25, 0.125, and 0.0625 mg/mL, and blank. The samples were then mixed with sample buffer [0.5 M Tris-HCL at pH 6.8, 10% (v/v) glycerol, 2% (w/v) SDS, and 0.025% (w/v) bromophenol blue] at a ratio of 4:1 before loading the samples onto the gel. SDS-PAGE was performed in a vertical mini-slab gel (Mini-PROTEAN® III system, Bio-Rad). The gel was composed of 12.5% resolving gel [1.5 M Tris-HCL, pH 8.8] and 4% stacking gel [0.5 M Tris-HCl, pH 6.8]. Thirty µg of each sample was loaded onto the gel and SDS-PAGE was conducted at a constant voltage of 120 V. After the separation process, the gel was stained with Coomassie blue solution [0.1% (w/v) Coomassie brilliant blue R250, 40% (v/v) methanol, and 10% (v/v) glacial acetic acid] for 30 minutes, then de-stained with de-staining solution [40% (v/v) methanol and 2% (v/v) glacial acetic acid]. The gel image was captured using ChemiDocTM Imaging System (Bio-Rad) and was analyzed using Quantity One 1-D software (Bio-Rad). The sensitivity for band detection was 20.00 and the bands were matched with 5.0% tolerance.
| Percentage (%) | Amount of Urine (µL) | Amount of Salt (g) |
|---|---|---|
| 45 | 200 | 0.06 |
| 70 | 200 | 0.10 |
| 90 | 200 | 0.13 |
Results
Urinary protein was concentrated and purified using salting out technique, without concentrating the urine, since it was too dilute to visualize the protein on SDS-PAGE. Different quantities of salt were used in this study to achieve different ammonium sulphate salt saturations (Table 2).

Figure 1 shows the gel image of the urinary protein profile after ammonium sulphate precipitation. In terms of the number of protein bands detected, the best salt saturation percentage was 45%, where 16 protein bands were detected, as compared to 12 bands for 70% saturation and 10 bands for 90% saturation. Therefore, 45% saturation was used for the subsequent experiments.

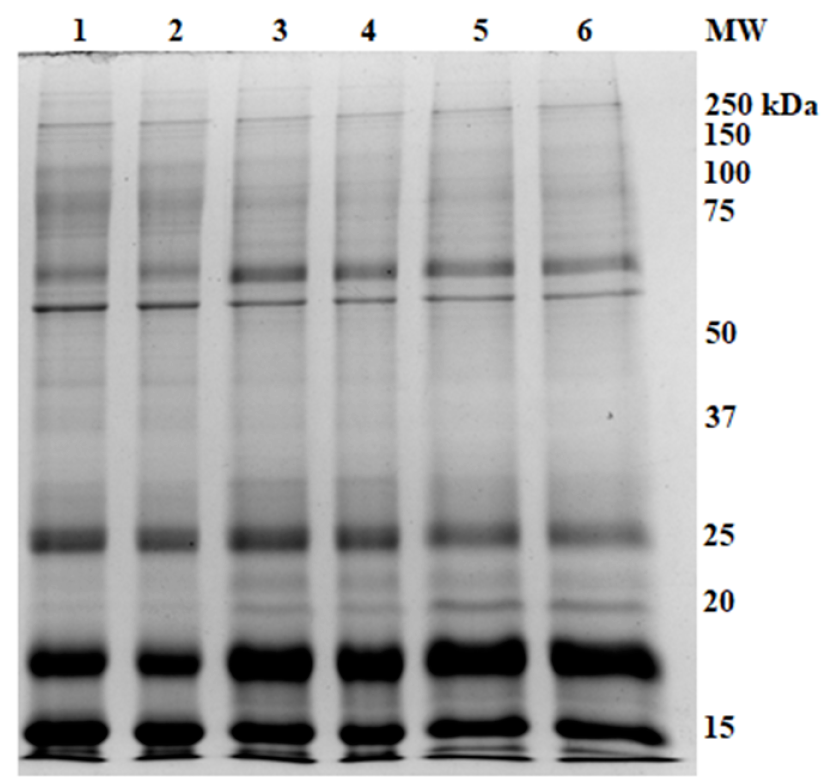
Each rat’s urinary protein (n=6 rats) from the same group was subjected to SDS-PAGE separation. An example of healthy rats with ND (G1) is shown in Figure 2; the common protein bands were identified and then used for the basis of comparison with other groups of rats. Figure 4, Figure 3 show the comparison of urinary protein profiles from diabetic rats and pre-diabetic rats, respectively.
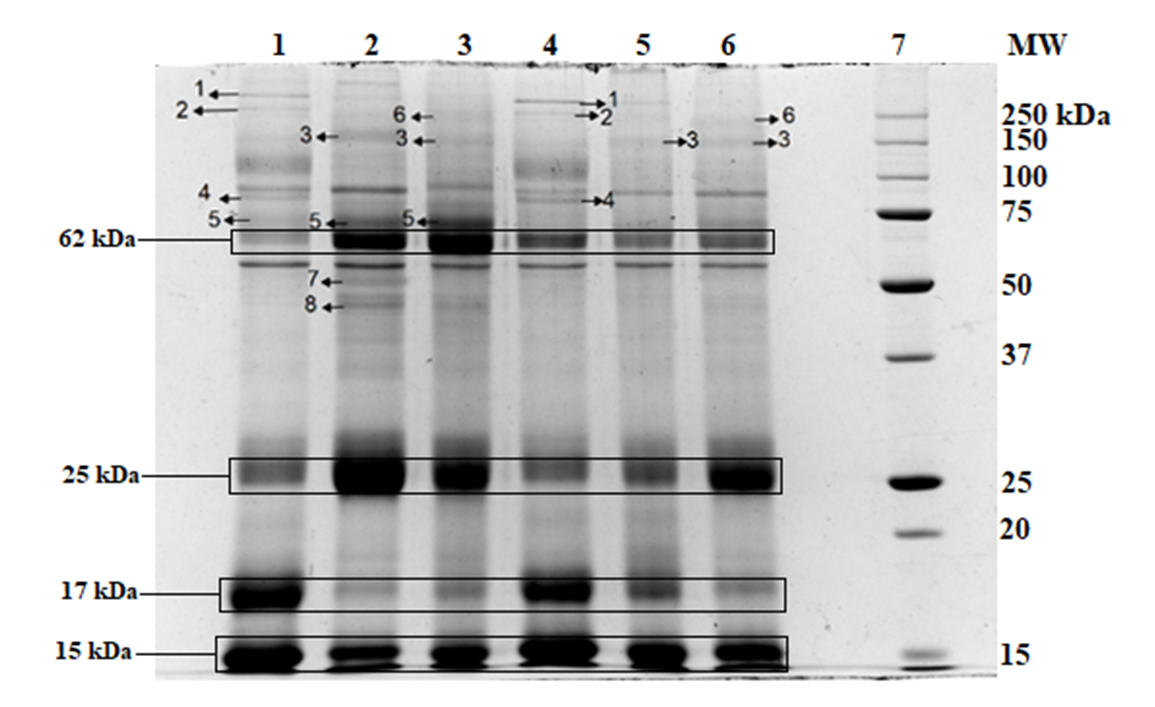

The protein bands with MW of 350 kDa (protein band 1) and 280 kDa (protein band 2) were found in control healthy rats- either fed with ND or HFD (Figure 4, Figure 3: G1 and G4, respectively), as well as pre-diabetic groups with metformin treatment, regardless of the diet (Figure 4: G8 and G10). The protein band at molecular weight of 170 kDa (protein band 3) was only found in the diabetic group (Figure 3: G2, G3, G5 and G6) when compared to all healthy rats and pre-diabetic rats. Moreover, the protein band at MW of 85 kDa (protein band 4) was seen only in healthy rats (Figure 4, Figure 3: G1 and G4) and pre-diabetic rats (Figure 4: G7 to G10). However, the band was faint in pre-diabetic rats with ND that were treated with metformin (G8). The protein band at MW of 72 kDa (protein band 5) was found in healthy rats and diabetic rats fed with ND, with or without metformin (Figure 3: G1 to G3). Furthermore, the protein band at 257 kDa (protein band 6) was seen in diabetic rats treated with metformin (Figure 3: G3 and G6) and pre-diabetic rats receiving HFD and metformin treatment (Figure 4: G10). Lastly, the protein bands with MW at 51 kDa (protein band 7) and 46 kDa (protein band 8) were only found in diabetic rats fed with ND (Figure 3: G3).

There were four intense bands found at molecular weight of 62 kDa, 25 kDa, 17 kDa, and 15 kDa that were differentially excreted. The intensity of protein bands are shown in Figure 5. In general, the protein bands of 62 kDa, 25 kDa and 17 kDa showed variation between animal groups while there were no significant changes seen in intensity of protein bands at molecular weight of 15 kDa across all groups.
Discussion
Sample preparation was done by salt precipitation using ammonium sulphate. Ammonium sulphate salt was used because it is relatively inexpensive, easily accessible, and can prevent denaturation of proteins13. Increasing salt saturation leads to increase of water surface tension as well as hydrophobic interactions between protein and water, thus causing a decrease of protein solubility, which then promotes protein aggregation14. However, the solubility of proteins varies as a function of ammonium sulphate saturation13. In this study, 45% salt saturation was found to give the best yield.
During overnight collection of urine, animals were given free access to water. The volume of urine collected from diabetic rats was higher compared to that of control rats and pre-diabetic rats. This resulted in a low amount of protein per volume of urine (data not shown). Therefore, in this study, we used protein quantity as the basis of comparison. Previous studies have demonstrated that STZ-induced diabetic rats produce more urine compared to normal rats. STZ initiates destruction of Langerhans islets cells irreversibly and induces diabetes in rats 15. This phenomenon may cause diabetes insipidus, or polyuria, which leads to large amounts of diluted urine produced that contributes to frequent urination and thirst of diabetic rats. In this study, we treated a group of animals (diabetic and pre-diabetic) with metformin, a commonly used drug to treat diabetic patients. This drug lowers blood glucose levels without causing overt hyperglycemia16.
SDS-PAGE is a simple and reliable method to resolve proteins by molecular weight. From the analysis, proteins in the urine of control rats (G1 and G4) and pre-diabetic rats (G7 to G10) have a molecular weight ranging from 350 kDa to 15 kDa, while urinary proteins of diabetic rats (G2, G3, G5 and G6) range from 434 kDa to 15 kDa. Nevertheless, the detection of band 434 kDa was inconsistent among the groups of diabetic rats.
Four intense bands with molecular weight at 62 kDa, 25 kDa, 17 kDa, and 15 kDa were found in the urinary profile of all the rats. A faint and broad protein band at 62 kDa is an indication of healthy rats with healthy diet (G1). In this study, we found that band 62 kDa was excreted in high quantities in diabetic and pre-diabetic rats and healthy rats fed with HFD. However, the 62 kDa protein was detected as a faint band in control rats with ND (G1) and pre-diabetic rats receiving ND and metformin treatment (G8).
Although protein band 25 kDa is also an intense band in the urinary protein profile, it can be used as an indicator for diabetic rats with or without metformin treatment. The protein band at 25 kDa was found to be relatively faint in control rats (G1 and G4) and pre-diabetic rats with ND (G7 and G8), when compared with diabetic rats.
In contrary to the above-mentioned bands, an intense protein band at 17 kDa was detected in the control rats (G1 and G4) and pre-diabetic rats, regardless of the diet intake (G7 to G10). Nevertheless, this band appeared to be faint in diabetic rats with or without metformin treatment (G2, G3, G5 and G6). Additionally, protein band 15 kDa was intensely excreted in all groups of rats although no significant differences between the animals were detected in all the groups studied.
Many of the protein bands detected in this study were found to be unique in certain groups of animals; nevertheless, these protein bands were detected as common among the animals in the same group. Protein bands 350 kDa and 280 kDa were found solely in healthy rats (G1 and G4) and pre-diabetic rats with metformin treatment (G8 and G10), which may indicate that usefulness of metformin as an intervention strategy to prevent the progression of diabetes. The protein band at 170 kDa was solely seen in diabetic rats regardless of diet groups (G2, G3, G5 and G6). Moreover, the protein band at 85 kDa was detected in healthy (G1 and G4) and pre-diabetic rats, regardless of diet or treatment (G7 to G10), but not detected in any of the diabetic rats. The protein band at 72 kDa was detected in control and diabetic rats with ND (G1, G2 and G3); therefore, it may be a protein that was related to the diet intake. The protein band at 257 kDa was detected in diabetic rats with metformin treatment, regardless of diet (G3 and G6), and in pre-diabetic rats with HFD that were treated with metformin (G10). Lastly, the proteins bands at 51 kDa and 46 kDa were detected in diabetic rats with ND (G2).
Conclusion
Analysis of the protein profiles has indicated that there are noticeable changes in the protein excretion of the different groups of rats. The excretion and non-excretion of marker proteins, namely protein bands at MW 350 kDa, 280 kDa, 170 kDa, 85 kDa, 51 kDa and 46 kDa, can be used to indicate the state of disease as diabetic or non-diabetic, while the differential excretion of protein bands at MW 62 kDa, 25 kDa and 17 kDa can be used to indicate the progression of the pre-diabetic state of disease. In comparing the urinary protein profiles, it was demonstrated that early treatment of metformin and controlled diet intake by pre-diabetic (G8) rats seem to be benefiting them by delaying the onset of diabetes in these rats. This observation is in agreement with their blood glucose levels where G8 animals showed a drop in blood glucose levels to 4.8 mmol/L, which is considered a healthy level (FBG <5.60 mmol/L), while pre-diabetic rats in other groups remained as pre-diabetic, according to their blood glucose levels after 6 weeks of study.
Abbreviations
DN: Diabetic nephropathy
DTT: Dithiothreitol
EDTA: Ethylenediaminetetra-acetic acid
FBG: Fasting blood glucose
HCL: Hydrochloric acid
HFD: High fat diet
IP: intraperitoneal injection
kDa: kilo Dalton
MW: Molecular weight
NA: nicotinamide
ND: Normal diet
PAGE: Polyacrylamide gel electrophoresis
RC/DC: Reducing agent and detergent compatible
SDS: Sodium dodecyl sulfate
STZ: Streptozotocin
T2DM: Type 2 Diabetes Mellitus
TEMED: N,N,N’,N’-tetramethyethylenediamine
Competing Interests
The author(s) declare(s) that there is no conflict of interest regarding the publication of this paper.
Authors' Contributions
Conceptualization: Lay-Harn Gam, Vikneswaran Murugaiyah, Baharudin Ibrahim and Peter Greimel; Methodology: Xuan-Yi Sim, Yan-Fen Lee, Waqas Ahmad and Ying-Hui Teh; Analysis: Ying-Hui Teh, Lay-Harn Gam and Mohd Nazri Ismail; Writing-draft and preparation: Ying Hui-Teh; Writing-review and editing: Lay-Harn Gam, Yan-Fen Lee and Waqas Ahmad.
Acknowledgment
We would like to thank URICAS for funding this project with the grant number 1001/PFARMASI/870034. We would like to thank School of Pharmaceutical Sciences, USM for providing us facilities to carry out this project.
References
-
Cho
N.H.,
Shaw
J.E.,
Karuranga
S.,
Huang
Y.,
da Rocha Fernandes
J.D.,
Ohlrogge
A.W.,
IDF Diabetes Atlas: global estimates of diabetes prevalence for 2017 and projections for 2045. Diabetes Res Clin Pract.
2018;
138
:
271-81
.
View Article PubMed Google Scholar -
Gray
L.J.,
Willis
A.,
Webb
D.,
Davies
M.J.,
Khunti
K.,
Diabetes Epidemiology, Genetics, Pathogenesis, DiagnosisSpringer International Publishing: Cham; 2018.
View Article Google Scholar -
Zheng
Y.,
Ley
S.H.,
Hu
F.B.,
Global aetiology and epidemiology of type 2 diabetes mellitus and its complications. Nat Rev Endocrinol.
2018;
14
(2)
:
88-98
.
View Article PubMed Google Scholar -
Hariri
N.,
Thibault
L.,
High-fat diet-induced obesity in animal models. Nutr Res Rev.
2010;
23
(2)
:
270-99
.
View Article PubMed Google Scholar -
Heydemann
A.,
An overview of murine high fat diet as a model for type 2 diabetes mellitus. Journal of diabetes research.
2016;
2016
:
2902351
.
View Article Google Scholar -
Schwingshackl
L.,
Chaimani
A.,
Hoffmann
G.,
Schwedhelm
C.,
Boeing
H.,
A network meta-analysis on the comparative efficacy of different dietary approaches on glycaemic control in patients with type 2 diabetes mellitus. Eur J Epidemiol.
2018;
33
(2)
:
157-70
.
View Article PubMed Google Scholar -
Brannick
B.,
Wynn
A.,
Dagogo-Jack
S.,
Prediabetes as a toxic environment for the initiation of microvascular and macrovascular complications. Exp Biol Med (Maywood).
2016;
241
(12)
:
1323-31
.
View Article PubMed Google Scholar -
Reutens
A.T.,
Atkins
R.C.,
Epidemiology of Diabetic Nephropathy. Contrib Nephrol.
2011;
(170)
:
1-7
.
View Article PubMed Google Scholar -
Wada
J.,
Makino
H.,
Inflammation and the pathogenesis of diabetic nephropathy. Clin Sci (Lond).
2013;
124
(3)
:
139-52
.
View Article PubMed Google Scholar -
Vaishya
S.,
Sarwade
R.D.,
Seshadri
V.,
MicroRNA, Proteins, and Metabolites as Novel Biomarkers for Prediabetes, Diabetes, and Related Complications. Front Endocrinol (Lausanne).
2018;
9
:
180
.
View Article PubMed Google Scholar -
Rotbain Curovic
V.,
Hansen
T.W.,
Eickhoff
M.K.,
von Scholten
B.J.,
Reinhard
H.,
Jacobsen
P.K.,
Urinary tubular biomarkers as predictors of kidney function decline, cardiovascular events and mortality in microalbuminuric type 2 diabetic patients. Acta Diabetol.
2018;
55
(11)
:
1143-50
.
View Article PubMed Google Scholar -
Wai-Hoe
L.,
Wing-Seng
L.,
Ismail
Z.,
Lay-Harn
G.,
SDS-PAGE-Based Quantitative Assay for Screening of Kidney Stone Disease. Biol Proced Online.
2009;
11
(1)
:
145-60
.
View Article PubMed Google Scholar -
R.R. Burgess,
Methods in Enzymology 463Academic Press 2009.
Google Scholar -
Wingfield
P.,
Protein precipitation using ammonium sulfate. Curr Protoc Protein Sci. Appendix.
2001;
3
:
3
.
-
Akbarzadeh
A.,
Norouzian
D.,
Mehrabi
M.R.,
Induction Of Diabetes By Streptozotocin In Rats. Indian J Clin Biochem.
2007;
22
(60)
.
View Article Google Scholar -
Rena
G.,
Hardie
D.G.,
Pearson
E.R.,
The mechanisms of action of metformin. Diabetologia.
2017;
60
(9)
:
1577-85
.
View Article PubMed Google Scholar
Comments
Downloads
Article Details
Volume & Issue : Vol 7 No 1 (2020)
Page No.: 3593-3601
Published on: 2020-01-31
Citations
Copyrights & License
This work is licensed under a Creative Commons Attribution 4.0 International License.
Search Panel
- HTML viewed - 6407 times
- Download PDF downloaded - 1740 times
- View Article downloaded - 0 times
