

Copyrights: Vy Thi-Kieu Tu, Ha Thi-Ngan Le, Xuan Hoang-Viet To, Phuc Dang-Ngoc Nguyen, Phat Duc Huynh, Thuan Minh Le, Ngoc Bich Vu, 2020. License: This work is licensed under a Creative Commons Attribution 4.0 International License.
Abstract
Introduction: Cartilage damage is one of the injuries that is difficult for the human body to self-repair due to the avascular and completely mature tissue with only few stem or progenitor cells present. Recently, some studies showed that engineered cartilage tissues could be used to treat or improve this injury. This study aimed to produce the cartilage microtissues from the differentiation of scaffold-free spheroids composed of human adipose-derived stem cells.
Methods: Human adipose-derived stem cells (ADSCs) were isolated and expanded following the previously published study. They were then cultured in the non-adherent condition to produce spheroids. The spheroids of the ADSCs were collected and induced into cartilage microtissues in the inducible medium for 21 days. The cartilage microtissue was characterized by some cartilage phenotype markers, including the accumulation of extracellular matrix proteins (aggrecan, glycosaminoglycan, and type II collagen), and the expression of certain genes specific to chondrocytes (Sox9, Col2, Col1, and Acan).
Results: The results showed that the expression of chondrocyte-specific genes gradually increased during the 21 days of culture for differentiation. On day 21, the microtissues expressed aggrecan, glycosaminoglycan, and type II collagen proteins.
Conclusion: This study demonstrated that cartilage microtissues could easily be produced from scaffold-free spheroids from ADSCs. Thus, cartilage microtissues can be produced in this manner for in vivo transplantation to promote cartilage regeneration, or to produce cartilage tissues for in vitro studies.
Introduction
Cartilage is one of four specialized elastic connective tissue types in the human body. In the adult body, cartilage covers the end of bones, and constitutes the bronchial tubes, rib cage, ear, nose, and intervertebral disc. Cartilage is composed of chondrocytes and extracellular matrix (ECM)1, which consists of glycoproteins, collagens (collagen type II, IX, and XI), proteoglycans, and hyaluronan (synthesized by chondrocytes)2, 3. Unlike other tissues, chondrocytes are the only cells found in cartilage. The number of chondrocytes usually accounts for 1–5% of the total cartilage tissue volume4, 5. The ECM determines the mechanical properties (solidity and elasticity) of cartilage6, 7. Moreover, unlike the other connective tissues, cartilage tissues do not contain blood vessels and nerves6, and therefore, utrition is provided to cartilage cells by diffusion8. That is why this tissue is the most difficult self-repairing tissue compared to other injured tissues6, 7, 8, 9.
Currently, there are various strategies to treat damaged cartilage, depending on the condition, location, and size of the injury. With traditional strategies, patients may be given medication to control mild pain or have to undergo surgery in severe cases10. In the case of large lesion size, joint replacement surgery is needed10, 11. However, these strategies exhibit some disadvantages, such as the limited source of tissue, immune responses, infection, and/or implant failure11, 12, 13, as well as no cartilage regeneration. Thus, cartilage regeneration medicine becomes a promising strategy. In addition to stem cell transplantation, transplantation of engineered cartilage tissues produced from stem cells (combined with growth factors), grown on scaffolds, is considered as a promising approach for the treatment of cartilage deficiency10, 14.
Chondrocytes originate from the mesoderm15. Therefore, mesenchymal stem cells (MSCs) are an ideal cell source to produce engineered cartilage tissues16, 17. MSCs themselves can form a three-dimensional (3D) structure without the support of a scaffold18. By using non-adhesion culture techniques, MSCs can aggregate to form a 3D structure called a spheroid19. There are some various techniques to produce spheroids, including hanging drop plates20, 21, spinner flasks22, 23, multiple-funnel cell culture devices (MP device)24, and AggreWell plates25.
On the other hand, the in vitro spherical structure may cause some limitations related to the diffusion of nutrients, such as oxygen into the spheroid and waste out from the spheroid, especially at the spheroid core26, 27, 28. However, the condition of the microenvironment of cartilage tissue in vivo is somewhat similar29 therefore, the use of spheroids to create ‘artificial’ cartilage tissue may be a favorable and relevant model for investigations of in vivo cartilage repair.
In cartilage tissue engineering, most of the publications have showed that natural or synthetic polymeric materials, or a combination of the two, are typically used as scaffolds for cell adhesion30, 31, 32. Moreover, several studies have used scaffold-free approaches33, 34. In this study, we aim to use an established protocol to produce cartilage microtissues from the scaffold-free spheroids composed from adipose-derived stem cells (ADSCs).
Methods
Expansion of human ADSCs
ADSCs were isolated and cryopreserved according to a previously published study35. ADSCs were thawed and expanded in T-75 flasks (SPL Life Science, Gyeonggi-do 487 835, Korea) using ADSC-expanding medium (ADSCCult I medium, Regenmedlab, Ho Chi Minh City, Viet Nam) at 37oC, 5% CO2 conditions. When cell confluency reached approximately 70-80%, ADSCs were sub-cultured with Deattachment reagents (Regenmedlab, Ho Chi Minh City, Viet Nam).
Characterization of ADSC
ADSCs were characterized according to the minimal criteria defining MSCs, as suggested by the International Society for Cellular Therapy (ISCT). According to the ISCT, MSCs adhere to the surface of plastic, express particular MSC surface markers, and retain a multipotent differentiation potential36.
The expression of specific surface markers was detected by flow cytometry. ADSCs were stained with the following conjugated monoclonal antibodies: CD14-FITC (Santa Cruz Biotechnology, Dallas, TX), CD34-FITC (BD Biosciences, San Jose, CA), CD44-APC (BD Biosciences), CD73-PerCP-CP5.5 (Santa Cruz Biotechnology), CD90-PE (Santa Cruz Biotechnology), CD105-FITC (Santa Cruz Biotechnology), and HLA-DR-FITC (BD Biosciences). Staining took place for 15 minutes at room temperature in the dark, and then cells were washed twice to remove any free antibodies. Cells were resuspended in 300 µL of phosphate saline before they were analyzed in a BD FACSCalibur flow cytometer (BD Biosciences), using BD CellQuest Pro software (BD Biosciences). Isotypes were used in all assays.
The in vitro differentiation potential of ADSCs into adipocytes, osteoblasts, and chondroblasts was assessed using commercial kits StemPro™ Adipogenesis Differentiation Kit, StemPro™ Osteogenesis Differentiation Kit, and StemPro™ Chondrogenesis Differentiation Kit, respectively (Thermo Fisher Scientific, Waltham, MA). After 14 days of adipogenic differentiation, cells were stained with oil red dye (Sigma-Aldrich, St. Louis, MO) to detect lipid droplets within cellular cytosols. For osteogenic and chondrogenic differentiation, after 21 days of in vitro differentiation, differentiated cells were stained with Alizarin red dye (Sigma-Aldrich) to detect the accumulation of extracellular calcium, or Safranin O dye (Sigma-Aldrich) to detect glycosaminoglycans and proteoglycans. Before being stained, cells were washed twice with PBS and fixed in 4% PFA for 30 minutes. Then, they were dyed for 15 minutes and washed again gently with PBS.
Spheroid formation using hanging drop plate
ADSCs were suspended in the culture medium (ADSCCult I medium), and then they were seeded in a 96-well hanging drop plate (Perfecta3D® hanging drop plate; Sigma-Aldrich) with a volume of 50 μl for each drop of 1,000 cells per well. The plates were incubated at 37℃, 5% CO2, and then the formation of spheroids was observed after 24-96 hours. The diameter of spheroids was measured every day from day 1 to day 7 under an inverted microscope.
Live and dead cell assay
To confirm the cell viability, spheroids were double-stained with Hoechst 33258 (Sigma-Aldrich) and propidium iodide (PI) (Thermo Fisher Scientific). Spheroids were fixed in 4% PFA for 30 minutes then rinsed in 2X saline sodium citrate buffer (0.3 M NaCl, 0.03 M sodium citrate, pH 7.0; all were purchased from Sigma-Aldrich), and treated with 50 μl of 100 μg/mL RNase A (Sigma-Aldrich) for 20 minutes at 37℃. Then, spheroids were stained with 50 µl of 1 µg/mL Hoechst 33258 and 50 µl of 1g/ml PI dye for 5 minutes each at 37℃. Samples were washed three times in 2X SSC solution and observed under the ZEISS LSM 880 Confocal Laser Scanning Microscope (Carl Zeiss, Oberkochen, Germany).
Chondrogenic differentiation of ADSC spheroids
ADSC spheroids from hanging drop plates were collected and transferred to a 96-well plate coated with agarose (30 μl of 2% agarose per well) and cultured in differentiation medium (StemPro™ Chondrogenesis Differentiation Kit; Thermo Fisher Scientific) to induce chondrogenesis for 21 days. The spheroids were maintained in a 5% CO2, 37℃ incubator (Binder, Tuttlingen, Germany). The medium was refreshed every 5-7 days.
Histological and immunohistological analysis of differentiated ADSC spheroids
Spheroids were fixed in 4% PFA for 30 minutes, embedded in paraffin, and sectioned into slices of 3 μm thickness. Slices were placed on glass microscope slides. Samples were deparaffinized twice in xylene, then rehydrated through a graded series of alcohol for 5 minutes each. Briefly, sections were stained with hematoxylin (Sigma-Aldrich) for 5-7 minutes, followed by eosin (Sigma-Aldrich) staining for 15-30 seconds. Sections were additionally stained with Alcian blue (Sigma-Aldrich) and Safranin O/Fast green (Sigma-Aldrich) to confirm the accumulation of glycosaminoglycans as well as proteoglycans. For Alcian blue staining, after the nucleus staining, samples were stained with Alcian blue for 4-5 minutes, then quickly washed with 1% alcohol-acetic acid solution and rewashed with 70% ethanol. For Safranin O/Fast green staining, slides were stained with 0.05% Fast green solution for 10 minutes then rinsed quickly with 1% alcohol-acetic acid solution for 15 seconds. After that, samples were stained in 0.01% Safranin O solution for 3 minutes and rinsed with 95% ethanol then distilled water. Histological images were observed and recorded under the light microscope (Carl Zeiss, Oberkochen, Germany).
Immunohistology staining was performed to detect collagen II. After deparaffinization, sections were placed in Tris-EDTA buffer pH 9.0 at 100℃ for 20 minutes then washed under running cold tap water. Then, slides were washed twice in TBS plus 0.025% Triton X-100 with gentle agitation for 5 minutes each, and blocked with 10% goat serum solution (Thermo Fisher Scientific) for 2 hours at room temperature. Sections were then stained with Anti-Collagen II primary antibody (1:50, M2139; Thermo Fisher Scientific) in 1% BSA/TBS at 4℃ overnight. Sections then were stained with secondary antibody rat anti-mouse IgG1 (17-4015-82; Thermo Fisher Scientific) at 1:50 in 1% BSA/TBS for 60 minutes at room temperature in the dark. Free antibodies were removed by washing three times with TBS plus 0.025% Triton X-100 for 5 minutes each. Slides were covered in mounting medium with DAPI. The result was observed via the ZEISS LSM 880 Confocal Laser Scanning Microscope (Carl Zeiss, Oberkochen, Germany).
| Gen | Primer sequences (5’-3’) | Production (bp) | Accession numbers | |
|---|---|---|---|---|
| hSox9 | F | AGG ACC ACC CGG ATT ACA AG | 117 | M_000346.3 |
| R | CCT TGA AGA TGG CGT TGG G | |||
| hRunx2 | F | GGAGTGGACGAGGCAAGAGTTT | 133 | XM_011514966.2 |
| R | AGCTTCTGTCTGTGCCTTCTGG | |||
| hAcan | F | TCGAGGACAGCGAGGCC | 85 | XM_017021987.1 |
| R | TCGAGGGTGTAGCGTGTAGAGA | |||
| hCol2a1 | F | ATC CGG TAT TAG GGT CGC TTG | 115 | XM_017018831.1 |
| R | GAG GAG CGA CTG GAA GGT TT | |||
| hCol1a1 | F | TGACTGGAAGAGCGGAGAGT | 185 | XM_005257059.4 |
| R | TCTCTCCAAACCAGACGTGC | |||
| hβ-actin | F | AGAGCTACGAGCTGCCTGAC | 184 | NM_001101.4 |
| R | AGCACTGTGTTGGCGTACAG |
Quantitation of chondrocyte-related gene expression of spheroids
The expression of certain genes related to chondrogenesis, including Sox9, Col1, Col2, Acan, and Runx2, was estimated at day 10 and 21 of induction. These genes were compared to the housekeeping gene β-actin. RNA was extracted from chondrogenic spheroids and the control ones by using Easy Blue Total RNA Extraction Kit (iNtRON Biotechnology, Korea) following the manufacturer’s instruction. Quantitative RT-PCR was performed using 2x qPCRBIO SyGreen 1-Step Lo-ROX (PCRBIO Systems, London, UK) following the manufacturer’s instructions and using the gene-specific primers designed by PrimerBlast device (NCBI) (Table 1). Run parameters consisted of a single initial cycle of 45°C for 10 minutes and 95°C for 2 minutes, followed by 40 cycles of 95°C for 15 seconds, and 59°C for 15 seconds, and then end cycle 72°C for 15 minutes. The melting curves followed the default process of the real-time PCR device (Eppendorf, Hamburg, Germany). The expression rate of target genes of the sample was compared to the control (ADSC spheroid) by using the method of Livak: R =2-ΔΔCt37.
Statistical analysis
Data sets were statistically analyzed by ANOVA test using GraphPad Prism 8.0 (GraphPad Software, La Jolla, CA). Differences between all the groups were considered statistically significant when the p-value was less than 0.05.
Results
ADSCs displayed the particular mesenchymal stem cell phenotype
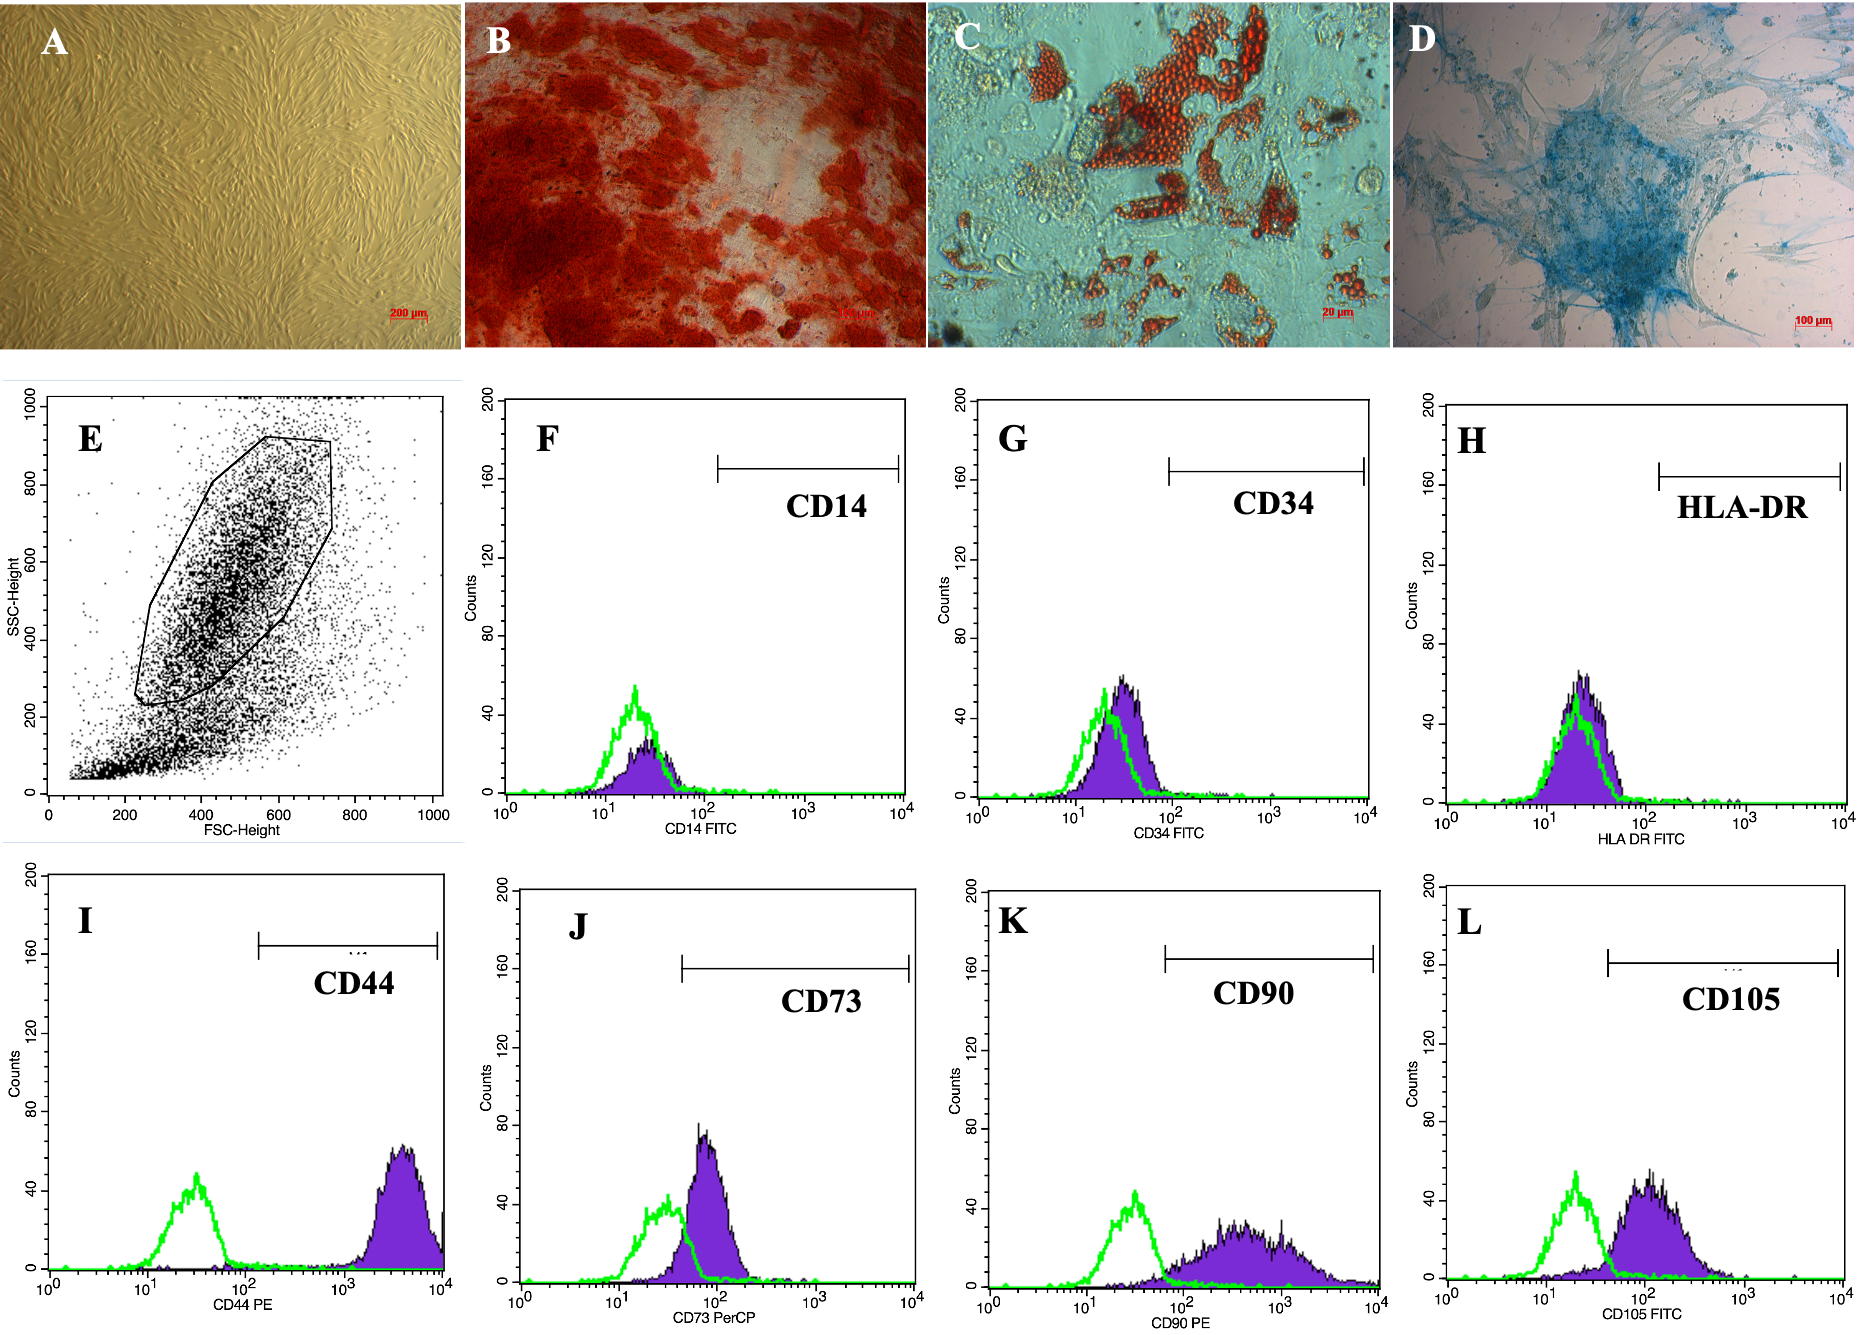
ADSCs displayed a particular morphological shape, which was an elongated shape like fibroblasts, when cultured in the plastic flasks (Figure 1A). ADSCs were verified for their differentiation potential to mesoderm-derived cells, including osteoblasts, chondrocytes and adipocytes. After induction in the osteogenic medium, ADSCs accumulated calcium in their extracellular matrix; therefore, these cells became red when stained with Alizarin red dye (Figure 1B). In the adipogenic medium, there were lipid droplets formed in cellular cytosols. These lipid droplets were stained with Oil Red O that became red (Figure 1C). Furthermore, in the chondrogenic medium, ADSCs were successfully differentiated into chondroblasts which were positive by Alcian staining assay because of the accumulation of proteoglycans (Figure 1D).
The flow cytometry results showed that the obtained ADSCs expressed high levels of CD44 (Figure 1I), CD73 (Figure 1J), CD90 (Figure 1K), and CD105 (Figure 1L), with 98.5 ± 0.46%, 98.9 ± 1.2%, 97.7 ± 2.2%, and 94.9 ± 1.8% cells staining positive, respectively. In contrast, they were virtually negative for CD14 (Figure 1F), CD34 (Figure 1G), and HLA-DR (Figure 1H), with only 0.08 ± 0.04%, 0.27 ± 0.24%, and 0.14 ± 1.0% cells staining positive, respectively.
Morphology of scaffold-free spheroids composed of ADSCs
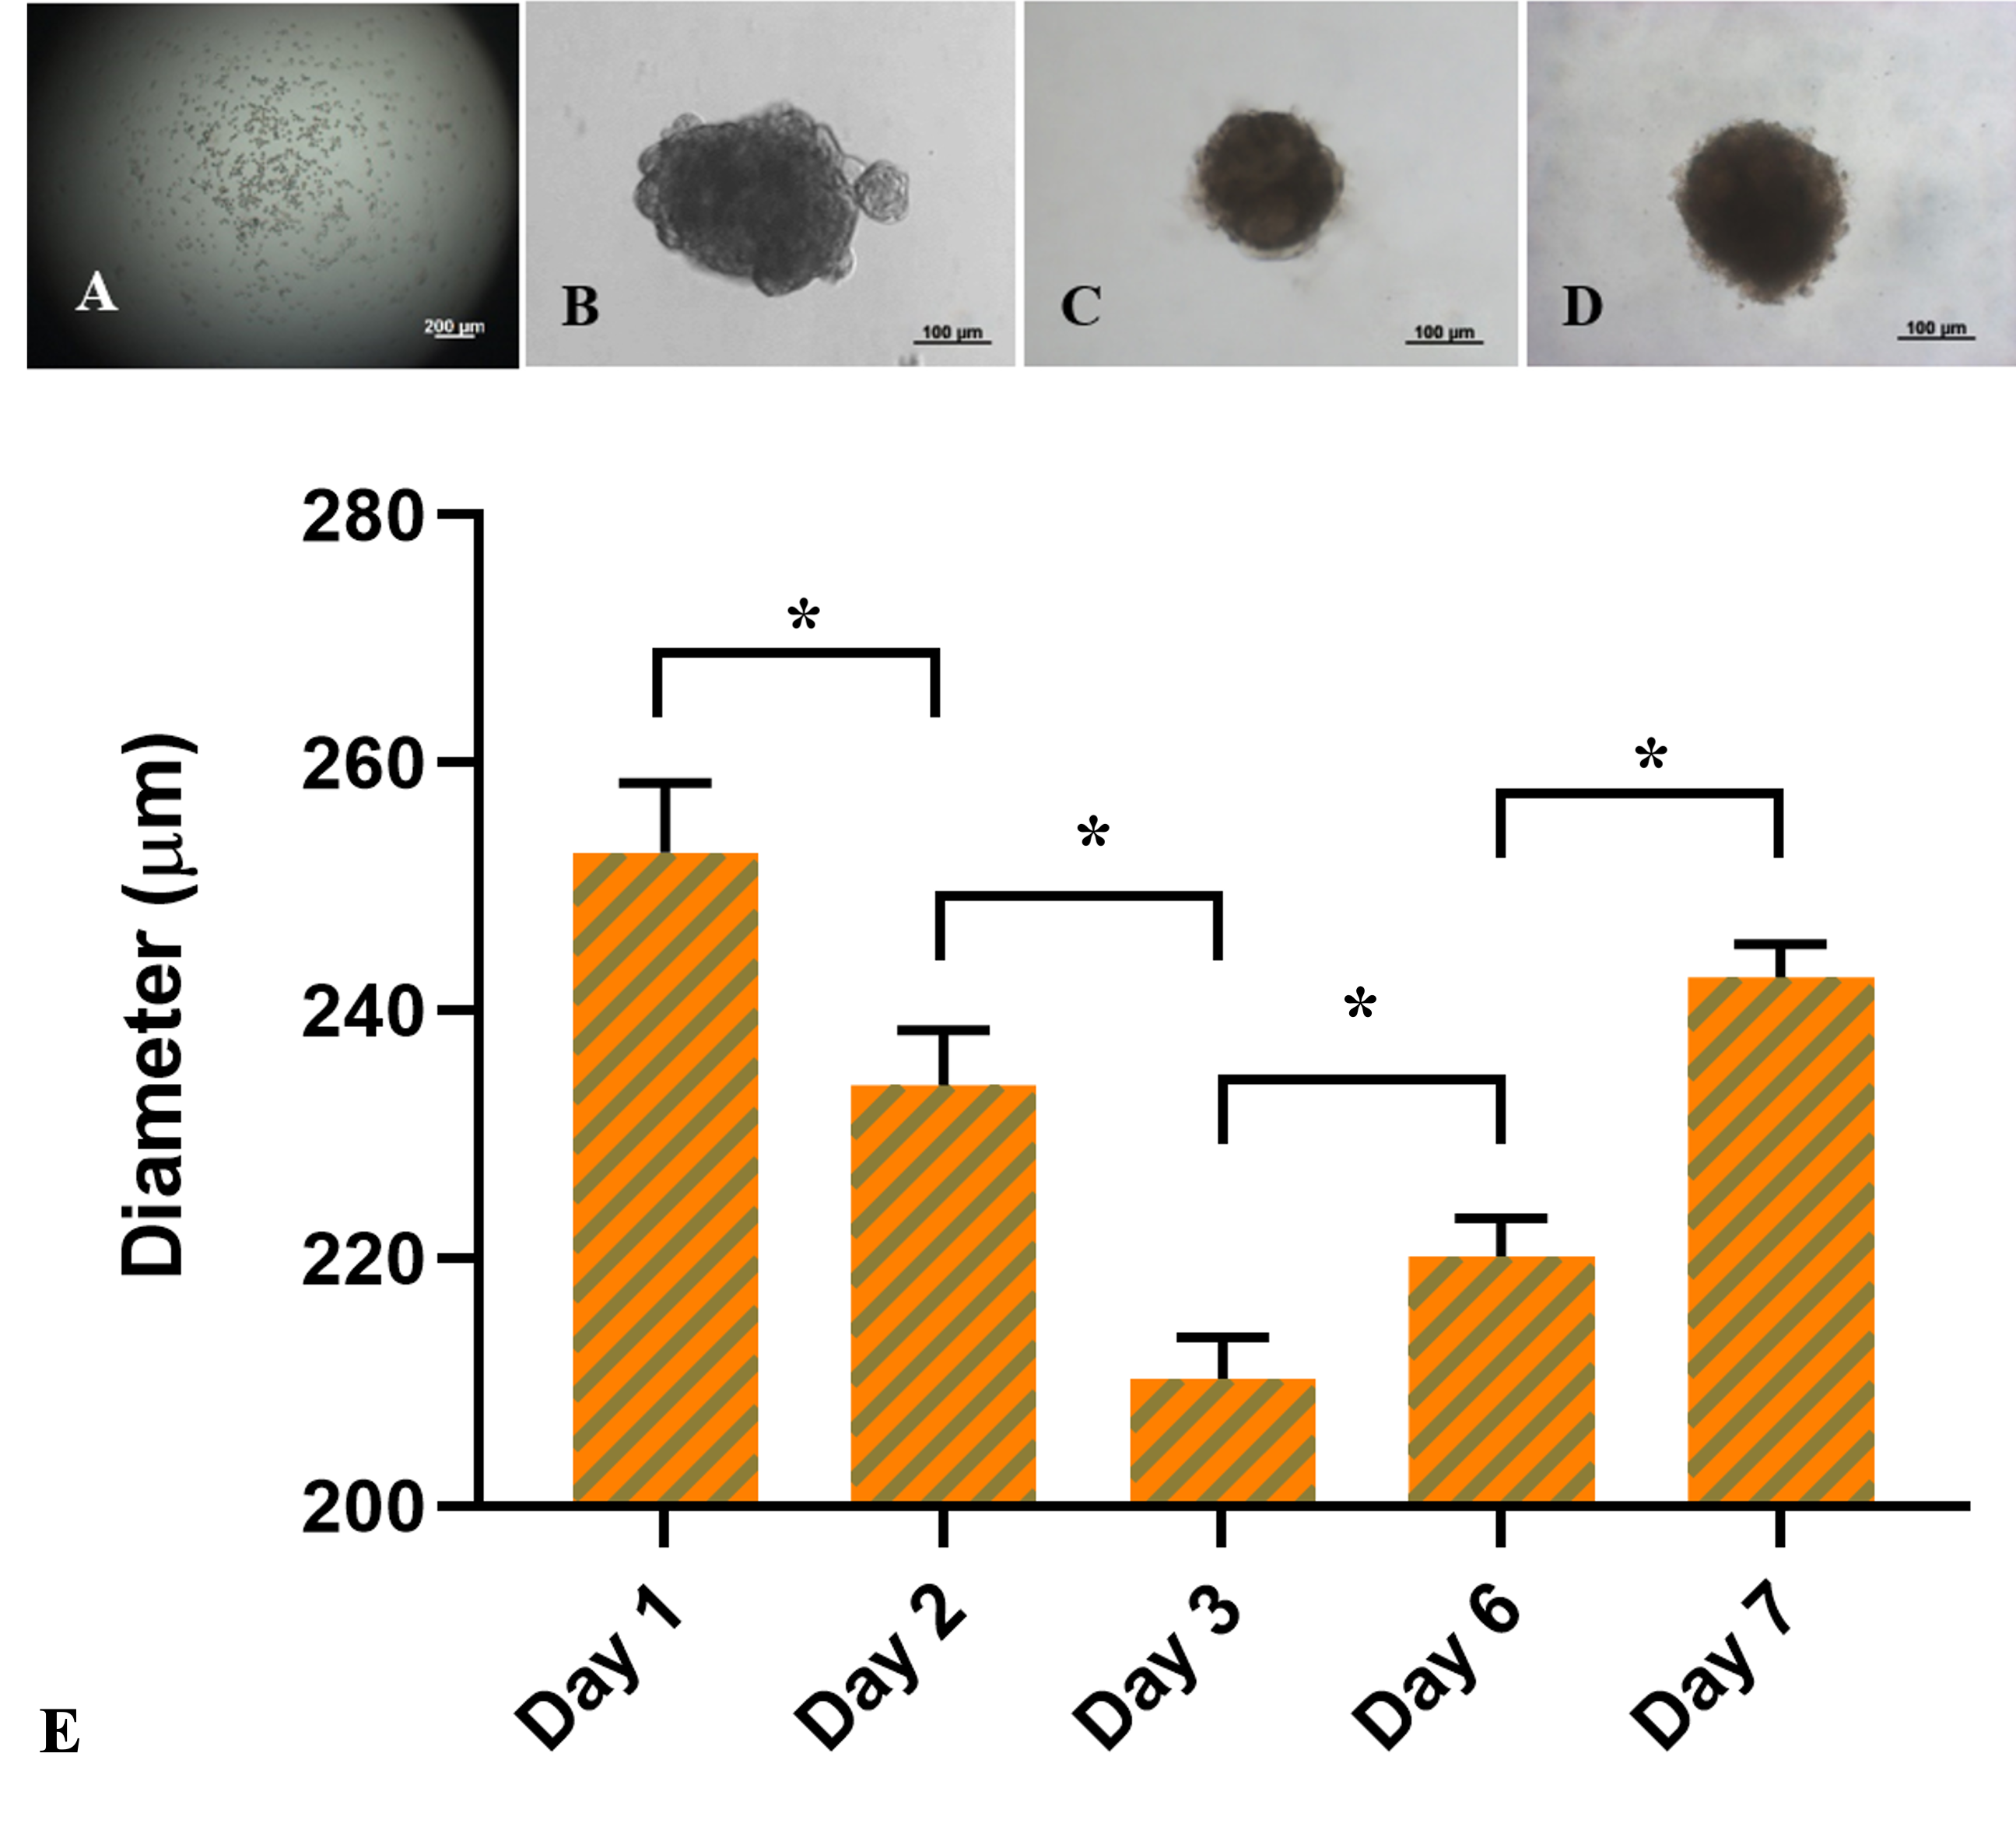
ADSC spheroids were formed at a dose of 1,000 cells/drop. One day after seeding, the cells settled at the bottom of the drop by the influence of gravity and tended to clump together to form a cell mass (Figure 2), compared to the first day (Figure 2A). The masses in the hanging drops were heterogeneous in shape, and the irregular and incomplete fringe constituted a unified mass due to a few outside discrete cell clusters. However, from day 3 to day 7 (Figure 2C-D), the fringe of the cell mass was more uniform with a rounded shape.
The bar chart in Figure 2E compared the size of the spheroids between day 1 and day 7. According to the data, the diameter of spheroids significantly decreased from 252.8 ± 5.6 μm at day 1 to 234.0 ± 4.4 μm at day 2, and 210.3 ± 3.3 μm at day 3, respectively (p < 0.05). On the third day, the cell mass remained spherical and considerably expanded to 220.2 ± 3.1 μm at day 6 (p < 0.05) and 242.7 ± 2.7 μm at day 7 (p < 0.05). In summary, the ADSC-derived cell masses on the third day of formation were the smallest and densest spheroids compared with those on the other days.
Structures of the ADSC spheroids
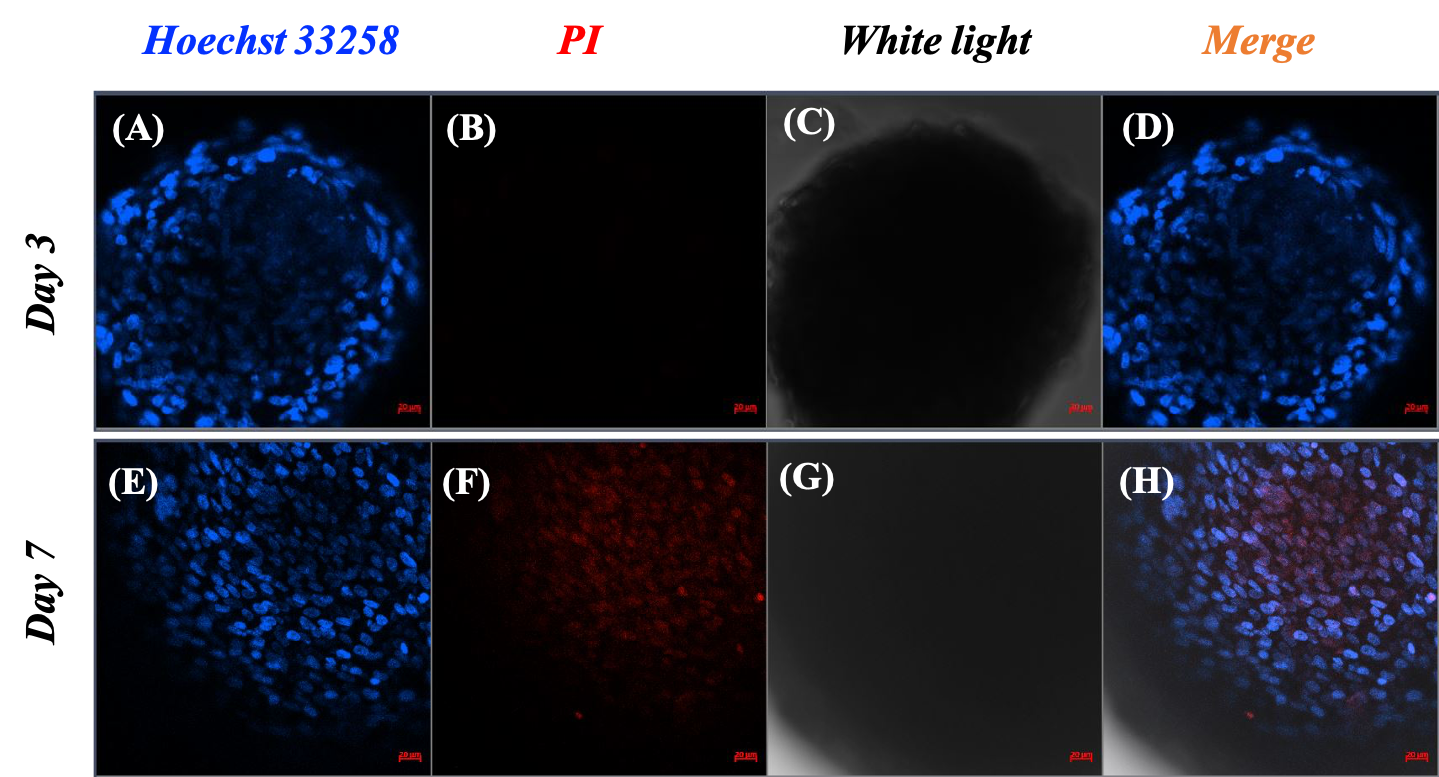
Based on the spheroid size changes within seven days, the spheroids were stable in structure and showed signs of proliferation starting on the third day. Therefore, the assessment of cell viability and cell death was carried out on day 3 and day 7. Spheroids at each time point were distinguished between live and dead cells by the blue color of Hoechst 33258 and the red color of PI. The pictures showed that there was an accumulation of live cells only, as illustrated by the distribution of the blue signal in the spheroids on day 3 (Figure 3A and C). Additionally, there was almost no visible red signal representing dead cells in the spheroid image on day 3 (Figure 3), but a large red signal area appeared in the center of the spheroid on day 7 (Figure 3F). In the merged images, the necrotic core noticeably appeared on spheroids on day 7, in contrast to the appearance of the core on day 3.
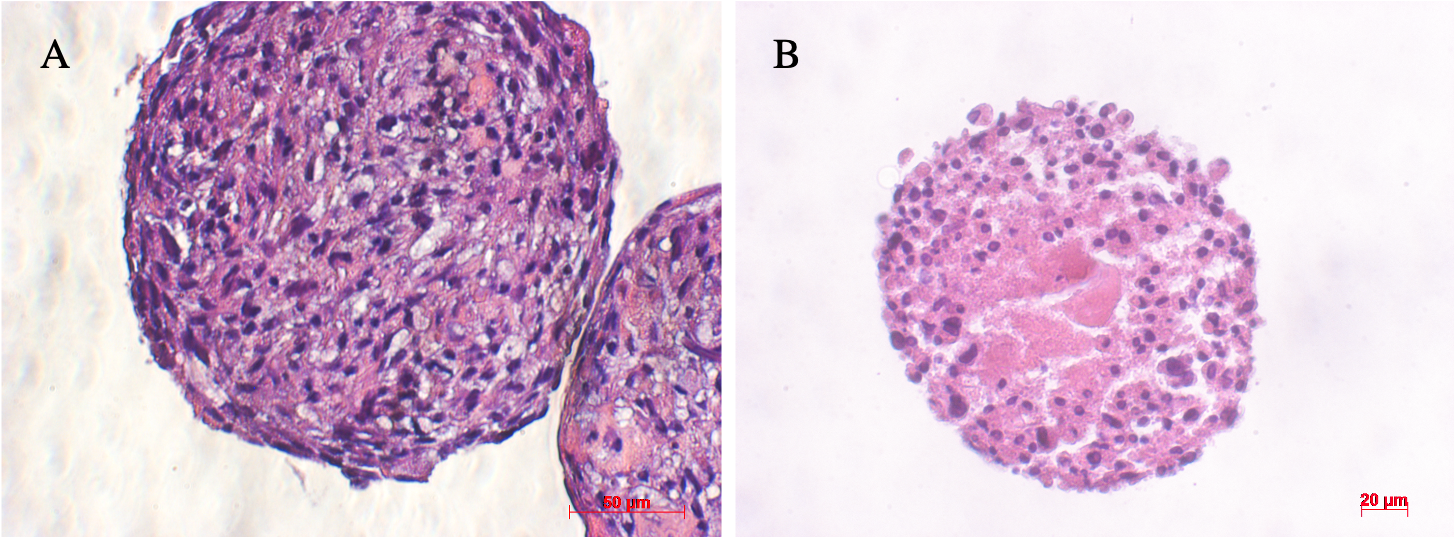
Hematoxylin and Eosin (H&E) staining of sections of ADSC spheroids on day 3 and day 7 provided similar conclusions as the results of the viability assessment above of the ADSC spheroids (Figure 4). The morphological features of spheroid sections differed from day 3 to day 7. On the third day, cells were evenly distributed throughout the spheroid. On the seventh day, cells mostly assembled in the outer layer of the spheroid, while in the central region the cells and their nuclei were swelling with pale eosinophilic cytoplasm. These results demonstrate that necrosis occurred in the core of the spheroid.
Chondrogenic-induced spheroids composed of ADSCs displayed cartilage phenotype
Histological analysis
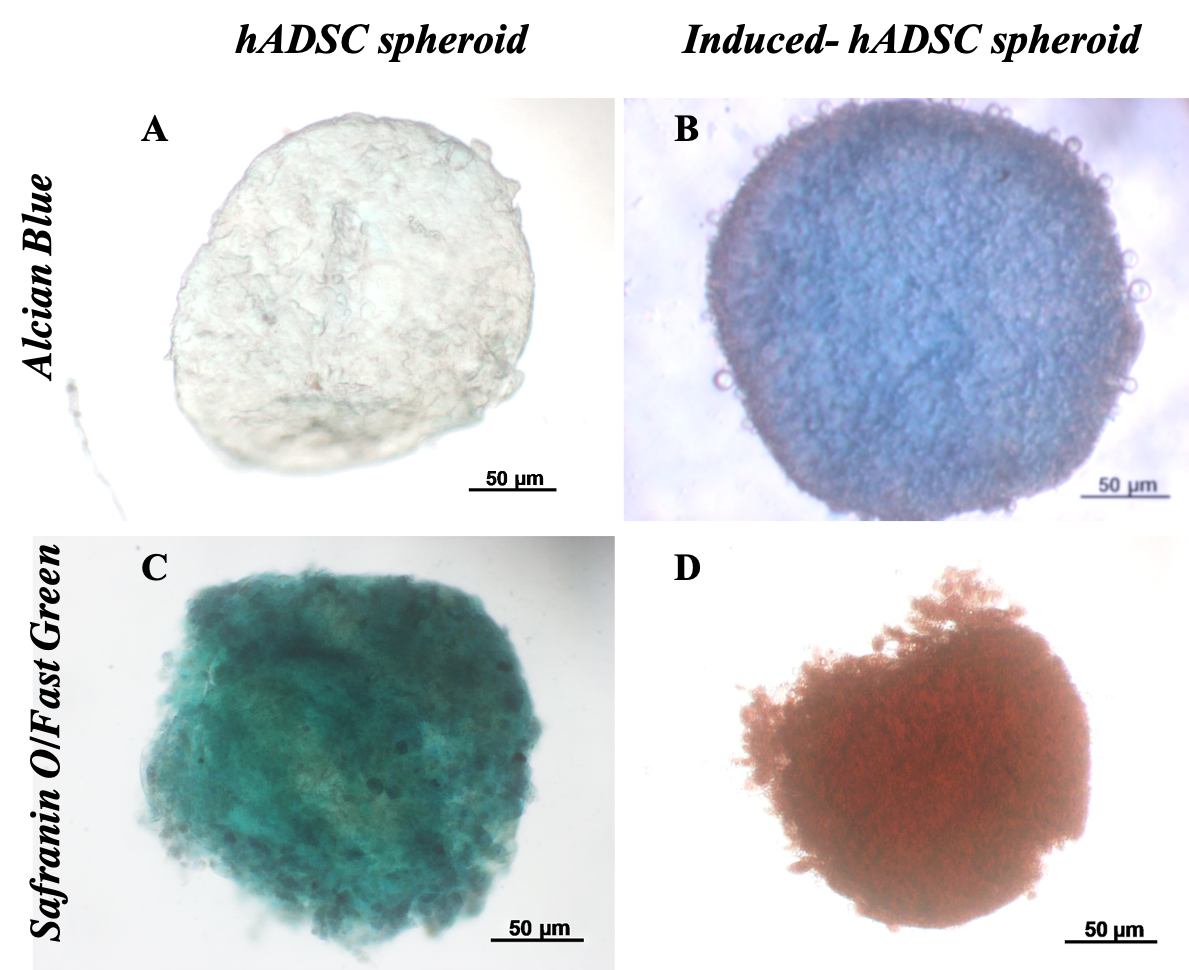
Histological analysis results showed that differentiated spheroids displayed the cartilage phenotype. These spheroids were positive with Alcian blue and Safranin O/Fast green (Figure 5). The spheroids positive with Alcian blue staining assay demonstrated that stem cells inside spheroids successfully accumulated sulfated glycosaminoglycans (GAGs) of cartilage. Indeed, non-inducible spheroids were negative with this assay.
Similarly, the double-staining of Safranin O/Fast Green dyes also showed that the control sample appeared only green in color. The green of the Fast green dye is typical for non-cartilage ingredients. Meanwhile, the 21-day differentiated spheroids were positive with safranin O (Figure 5D), and hence, spheroids were dyed red. This is the sign of changes in the substrate composition of non-cartilage tissue into cartilage tissue.
Expression of type II collagen
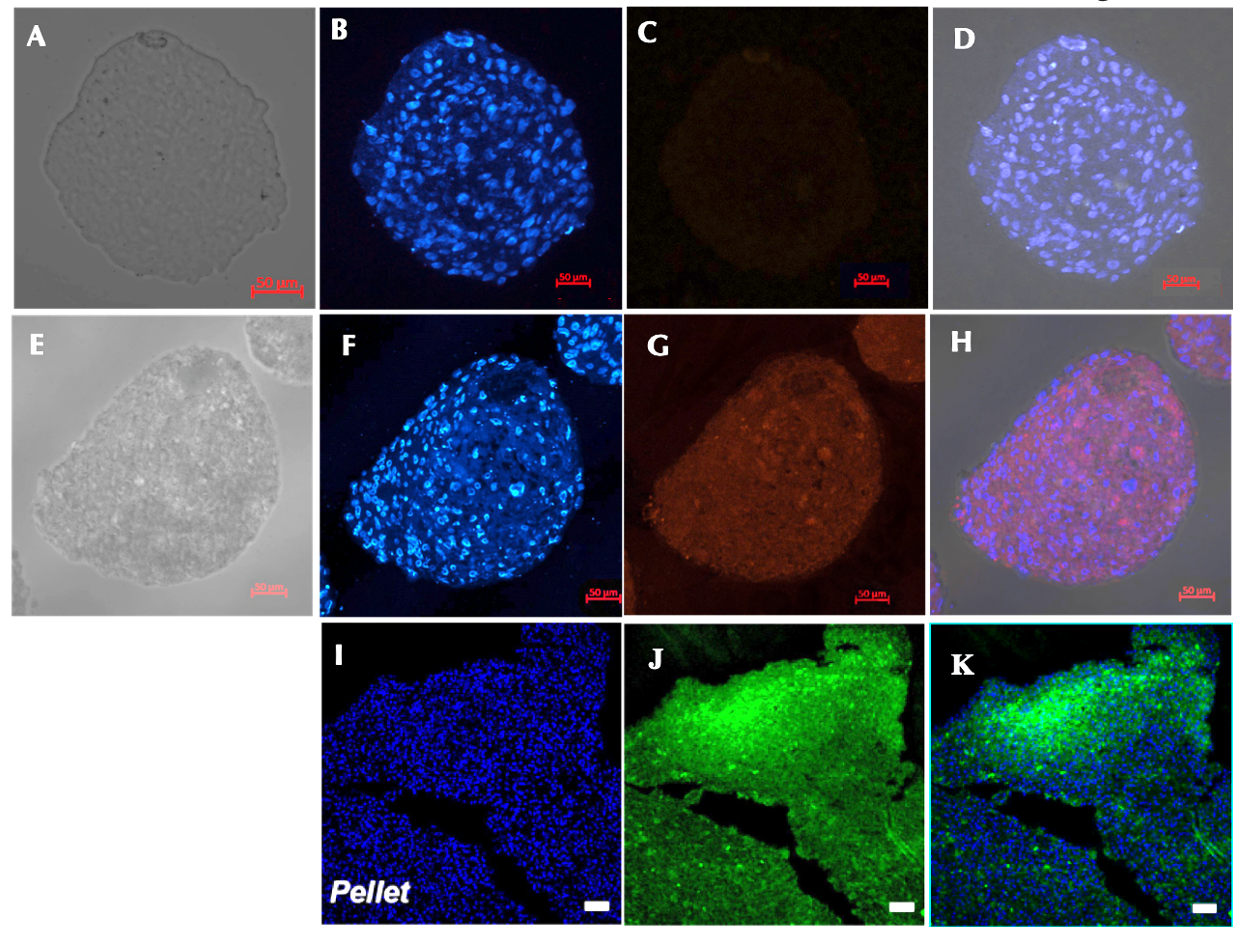
There was a significant difference in type II collagen expression between the control (Figure 6A-D) and the induction sample (Figure 6E-H). Immunofluorescence analysis of the chondrocyte spheroids revealed the formation of type II collagen on day 21. Meanwhile, there was no sign of type II collagen expression in the control group. These result are similar to those of previously published studies (Figure 6 I-K).
Cartilage-specific gene expressions
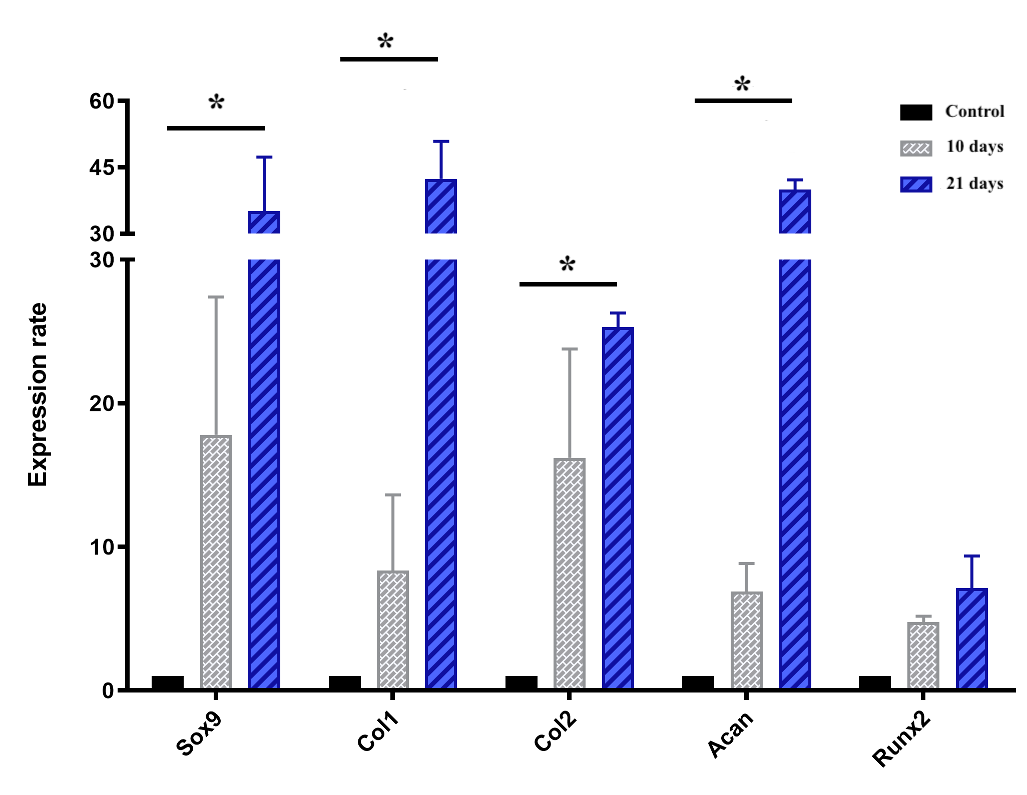
The chart of the expression of genes, including Sox9, Col1, Col2, Runx2 and Acan, which are all involved in chondrogenesis and cartilage formation, is shown in Figure 7. Briefly, all genes mentioned above were upregulated during the induction spheroids compared to the control spheroids. In the early stage (day 10), the expression levels of Sox9, col1, col2, acan, and Runx2 were upregulated by 17.8 ± 6.8, 8.3 ± 3.7, 16.2 ± 5.3, 6.9 ± 1.4, and 4.8 ± 0.3-fold, respectively, though the levels were not significantly (p > 0.05) different compared to ADSC spheroids. In the later stage (day 21), the expression levels of Sox9, Col1, Col2, and Acan were remarkably increased in the chondrogenic-induced ADSC spheroids (p < 0.05), compared to the control spheoids, reaching an increase of 35.1 ± 8.6, 42.4 ± 6.0, to 25.3 ± 0.01, and 40.0 ± 1.5-fold, respectively, despite the negligible increase of Runx2 (p > 0.05).

Discussion
Currently, there are many ways to repair cartilage damage, depending on the location and severity of the damage, age, and pathological state38. With a large area of cartilage tissue, cartilage tissue and cell transplantation are greatly effective solutions. However, these methods are limited because of dependence on tissue sources and donated cells, and donated sources are not sufficient to supply the transplanting needs. Therefore, the development of tissue engineering has brought about a promising solution combining the potential of stem cells and 3D culture to create cartilage microtissue towards regenerating tissue to respond to transplant needs to overcome the damage. In this study, we evaluated the induced, chondrogenic differentiation microtissue with respect to these characteristics: structure, matrix components, proteins, and gene expression.
In the first experiment, ADSCs were expanded and characterized. The results showed that the ADSC population possessed three characteristics of mesenchymal stem cells, following the minimal criteria and standards for defining multipotent mesenchymal stromal cells by the International Society for Cellular Therapy (ISCT), initially proposed by Dominici et al. (2006)36. Firstly, ADSC adhered on plastic when maintained in standard culture conditions. Secondly, ADSCs showed positive expression of CD44, CD73, CD90, and CD105; moreover, they were negative for CD14, CD34, and HLA-DR. Thirdly, the ADSC were capable of differentiating into mesenchymal functional cell lineages (adipocytes, osteocytes, and chondrocytes). Therefore, the ADSCs were qualified for further experiments.
Before cartilage microtissues were created, the ADSCs were cultured in non-adhesive surfaces using the hanging-drop method to form spheroids. After 24 hours, the cells came together and tended to form spheroids. However, the connection between cells was not tight such that the cell clump size mass was somewhat large. Over time, this interaction became tighter, compressing the cell mass to gradually form a uniform spherical shape, and thus leading to a decrease in size. The compression of the spheroids created an environment in which nutrient composition, oxygen concentration, and ability to transport nutrients to cells, even deep within cells, were lower than in monolayer culture. However, it did not reduce the survival of MSCs, cells that usually reside in places with lower oxygen levels than even liver or cancer cells39. Specifically, the spheroid size increased from day 3 to 7, showing signs of spheroid proliferation. However, on day 7, there were a great number of dead cells in the spheroid core; this was demonstrated by images of the spheroid sections after Hoechst and PI double-staining and H&E staining on day 7. PI is a fluorescent dye specific for double-stranded nucleic acids in apoptosis, necrosis, and fixed cells. It cannot enter normal living cell. The red color of PI dye identifie dead cells while the purple-blue color of Hoechst identifie the DNA of living and dead cells3.
Since diffusion of nutrients and metabolism decreased from the outside to the inside, the increase in size led to a nutritional deficiency within the core of the spheroid, causing cell death. Cell death occurred in increasing direction deep into the central spheroid, forming a necrotic core. Notably, this has been mentioned in a study by Murphy et al. (2017) in which it was observed that expression levels of enzymes involved in apoptosis increased as the spheroid size increased39. Furthermore, the limited diffuse range of small molecules, such as oxygen, is in the range of 150-200 μm from the outside to the inside 40. Another study showed that smaller sized spheroids had better metabolic activity and proliferation41. Therefore, the 200 μm-size spheroid at day 3 is better for the exchange and transport of oxygen, as well as nutrients, than the bigger size.
In the process of cartilage formation, the cells were induced to produce a variety of proteins that make up extracellular-specific cartilage matrix, including GAGs and aggrecan42, 43, 44. Aggrecan is an important proteoglycan of cartilage tissue by forming a gel structure that plays an intermediary role in the interaction between cartilage cells and between cartilage cells and ECM; therefore, aggrecan plays a role in tissue load capacity 45, osmotic swelling pressure42, hydraulic permeability, and deformation 46, 47. In cartilage, aggrecan is a proteoglycan that accounts for a high proportion42, 48, 49. Both aggrecan and GAG are molecules that are expressed in the early differentiation process and play a particularly important role in determining the stiffness and tolerance of cartilage tissue, typically articular cartilage tissue43, 44. In a publication from Li et al. (2018)50, the accumulation of GAG in human bone marrow derived stem cells (BMSCs) was very high, although the pellet size was larger than those seen in our study. In another study published by Futrega et al. (2015)45, GAG expression was higher in smaller- sized BMSC pellet (about 200 μm), compared to bigger ones. In the study of Futrega et al., with the same method to detect aggrecan, the accumulation showed similar results after staining of microtissue with Alcian blue45, 51, 52. Safranin O and Alcian blue are dye specific for proteoglycans 53. In our study, the presence of proteoglycan was detected by the red color after Safranin O/Fast green staining and the blue color after Alcian blue staining. The results of the double staining with Safranin O/Fast Green did not show the color of Fast Green, which is characteristic for mineralization. This indicates that on the 21st day of differentiation, there was no hypertrophy or ossification. Therefore, the accumulation of GAG in 200 μm-sized ADSC spheroids is a good indicator of the ability of ADSCs to differentiate into cartilage tissue.
The cartilage differentiation process is regulated by transcription regulatory factors, namely Sox9, together with Sox5 and Sox6, to activate and regulate the synthesis of extracellular matrix proteins, such as collagen I, collagen II, aggrecan, and GAG43. During the differentiation induction process, the increased expression of Sox9 results in the expression of genes, including Col1, Col2, and Acan. Col1 is strongly expressed at the beginning of cartilage differentiation, in particular, in the cell aggregation stage17. The strong expression of collagen I shows the presence of chondroblasts17, 54. Type II collagen is expressed very early, right at the later stage of cell aggregation, and this expression can increase over time and throughout the differentiation process17. In fact, Type II collagen makes up the highest proportion of collagen in cartilage tissue (about 85-90%), and is synthesized by chondrocytes 55. The study of Li et al. (2018)15 on the expression of type II collagen also showed that collagen expression was high, as characterized by the collagen II antibody staining in the blue fluorescent pellets (Figure 6K). In our study, after 21 days of differentiation, the induced-MSC spheroids showed a high expression of type II collagen as well. In summary, the high expression of these molecules in ADSC spheroid after 21 days of differentiation shows that the cartilage microtissue was created with an extracellular matrix component similar to articular cartilage tissue.
Conclusion
In this research study, cartilage microtissue was successfully generated from spheroids composed of ADSCs. After three days of hanging drop culture, the spheroid reached a diameter of about 200 μm. After 21 days of differentiation, cartilage microtissue expressed several particular features of cartilage tissue, including accumulation of aggrecan, GAG, and type II collagen, as well as enhanced expression of Sox9, Col2, and Acan genes. These evidence support that the microtissue can be considered as a cartilage tissue that has potential applications in cartilage implants.
Abbreviations
3D: three-dimensional
Acan: Aggrecan
ADSC: Adipose derived stem cells
CD: Cluster of differentiation
Col: Collagen
ECM: Extracellular matrix
GAGs: Glycosaminoglycans
H&E: Hematoxylin and Eosin
ISCT: International Society for Cellular Therapy
MSC: Mesenchymal stem cell
PI: Propidium iodide
Acknowledgments
Not applicable.
Author’s contributions
All authors equally contributed in this work. All authors read and approved the final manuscript.
Funding
This research is funded by the University of Science, VNU-HCM, under grant number T2018-34.
Availability of data and materials
Data and materials used and/or analysed during the current study are available from the corresponding author on reasionable request.
Ethics approval and consent to participate
Not applicable.
Consent for publication
Not applicable.
Competing interests
The authors declare that they have no competing interests.
References
-
Minina
E.,
Wenzel
H.M.,
Kreschel
C.,
Karp
S.,
Gaffield
W.,
McMahon
A.P.,
Vortkamp
A.,
BMP and Ihh/PTHrP signaling interact to coordinate chondrocyte proliferation and differentiation. Development (Cambridge, England).
2001;
128
(22)
:
4523-4534
.
-
Eyre
D.,
Collagen of articular cartilage. Arthritis research.
2002;
4
(1)
:
30-35
.
View Article PubMed Google Scholar -
Archer
C.W.,
Francis-West
P.,
The chondrocyte. The International Journal of Biochemistry & Cell Biology.
2003;
35
(4)
:
401-404
.
View Article Google Scholar -
Bhosale
A.M.,
Richardson
J.B.,
Articular cartilage: structure, injuries and review of management. British medical bulletin.
2008;
87
:
77-95
.
View Article PubMed Google Scholar -
Alford
A.W.,
Cole
B.J.,
Cartilage restoration, part 1: basic science, historical perspective, patient evaluation, and treatment options. The American journal of sports medicine.
2005;
33
(2)
:
295-306
.
View Article PubMed Google Scholar -
Fox
A.J. Sophia,
Bedi
A.,
Rodeo
S.A.,
The basic science of articular cartilage: structure, composition, and function. Sports health.
2009;
1
(6)
:
461-468
.
View Article PubMed Google Scholar -
Akiyama
H.,
Chaboissier
M.C.,
Martin
J.F.,
Schedl
A.,
Crombrugghe
B.,
The transcription factor Sox9 has essential roles in successive steps of the chondrocyte differentiation pathway and is required for expression of Sox5 and Sox6. Genes & Development.
2002;
16
(21)
:
2813-2828
.
View Article PubMed Google Scholar -
Rouwkema
J.,
Koopman
B.,
Blitterswijk
C.,
Dhert
W.,
Malda
J.,
Supply of nutrients to cells in engineered tissues. Biotechnology & genetic engineering reviews.
2010;
26
:
163-178
.
View Article PubMed Google Scholar -
Caldwell
K.L.,
Wang
J.,
Cell-based articular cartilage repair: the link between development and regeneration. Osteoarthritis and Cartilage.
2015;
23
(3)
:
351-362
.
View Article PubMed Google Scholar -
Nam
Y.,
Rim
Y.A.,
Lee
J.,
Ju
J.H.,
Current Therapeutic Strategies for Stem Cell-Based Cartilage Regeneration. Stem Cells Int 2018.
2018;
:
8490489-8490489
.
View Article PubMed Google Scholar -
Rubash
H.,
Berry
J.,
Revisions of hip and knee replacements in Canada. Canadian Joint Replacement Registry Analytic Bulletin: Canadian Institute for Health Information.
2004;
603
:
1-20
.
-
Temenoff
J.S.,
Mikos
A.G.,
Review: tissue engineering for regeneration of articular cartilage. Biomaterials.
2000;
21
(5)
:
431-440
.
View Article Google Scholar -
Zhang
L.,
Sirivisoot
S.,
Balasundaram
G.,
Webster
T.,
Nanoengineering for bone tissue engineering. Micro and Nanoengineering of the Cell Microenvironment: Technologies and Applications Norwood, MA: Artech House.
2008;
:
431-460
.
-
Zhang
L.,
Hu
J.,
Athanasiou
K.A.,
The role of tissue engineering in articular cartilage repair and regeneration. Crit Rev Biomed Eng.
2009;
37
(1-2)
:
1-57
.
View Article PubMed Google Scholar -
Umeda
K.,
Zhao
J.,
Simmons
P.,
Stanley
E.,
Elefanty
A.,
Nakayama N: Human chondrogenic paraxial mesoderm, directed specification and prospective isolation from pluripotent stem cells. Scientific Reports.
2012;
2
(1)
:
455
.
View Article PubMed Google Scholar -
Marion
N.W.,
Mao
J.J.,
Mesenchymal stem cells and tissue engineering. Methods Enzymol.
2006;
420
:
339-361
.
View Article Google Scholar -
Goldring
M.B.,
Tsuchimochi
K.,
Ijiri
K.,
The control of chondrogenesis. Journal of cellular biochemistry.
2006;
97
(1)
:
33-44
.
View Article PubMed Google Scholar -
Panchalingam
K.M.,
Jung
S.,
Rosenberg
L.,
Behie
L.A.,
Bioprocessing strategies for the large-scale production of human mesenchymal stem cells: a review. Stem cell research & therapy.
2015;
6
(1)
:
225
.
View Article PubMed Google Scholar -
Knight
E.,
Przyborski
S.,
Advances in 3D cell culture technologies enabling tissue-like structures to be created in vitro. J Anat.
2015;
227
(6)
:
746-756
.
View Article PubMed Google Scholar -
Hsiao
A.Y.,
Tung
Y.C.,
Qu
X.,
Patel
L.R.,
Pienta
K.J.,
Takayama
S.,
384 hanging drop arrays give excellent Z-factors and allow versatile formation of co-culture spheroids. Biotechnol Bioeng.
2012;
109
(5)
:
1293-1304
.
View Article PubMed Google Scholar -
Bartosh
T.J.,
Ylostalo
J.H.,
Preparation of anti-inflammatory mesenchymal stem/precursor cells (MSCs) through sphere formation using hanging-drop culture technique. Curr Protoc Stem Cell Biol.
2014;
28
(2B)
:
6
.
View Article PubMed Google Scholar -
Lin
R.Z.,
Chang
H.Y.,
Recent advances in three‐dimensional multicellular spheroid culture for biomedical research. Biotechnology Journal: Healthcare Nutrition Technology.
2008;
3
(9‐10)
:
1172-1184
.
View Article PubMed Google Scholar -
Mueller-Klieser
W.,
Multicellular spheroids. Journal of cancer research and clinical oncology.
1987;
113
(2)
:
101-122
.
View Article PubMed Google Scholar -
Sumi
S.,
Kawagoe
M.,
Abe
R.,
Yanai
G.,
Yang
K-C.,
Shirouzu
A multiple-funnels cell culture insert for the scale-up production of uniform cell spheroids. Regenerative Therapy.
2017;
7
:
52-60
.
View Article PubMed Google Scholar -
Antonchuk
J.,
Formation of embryoid bodies from human pluripotent stem cells using AggreWell™ plates. In: Basic Cell Culture Protocols. Springer.
2013;
523
(533)
.
View Article PubMed Google Scholar -
Mueller-Klieser
W.,
Three-dimensional cell cultures: from molecular mechanisms to clinical applications. The American journal of physiology.
1997;
273
(4)
:
C1109-1123
.
View Article PubMed Google Scholar -
Tsai
A.C.,
Liu
Y.,
Yuan
X.,
Ma
T.,
Compaction, fusion, and functional activation of three-dimensional human mesenchymal stem cell aggregate. Tissue engineering Part A.
2015;
21
(9-10)
:
1705-1719
.
View Article PubMed Google Scholar -
Cesarz
Z.,
Tamama
K.,
Spheroid Culture of Mesenchymal Stem Cells. Stem Cells Int 2016.
2016;
:
9176357-9176357
.
View Article PubMed Google Scholar -
Williams
R.M.,
Zipfel
W.R.,
Tinsley
M.L.,
Farnum
C.E.,
Solute transport in growth plate cartilage: in vitro and in vivo. Biophys J.
2007;
93
(3)
:
1039-1050
.
View Article PubMed Google Scholar -
Ossendorf
C.,
Kaps
C.,
Kreuz
P.C.,
Burmester
G.R.,
Sittinger
M.,
Erggelet
C.,
Treatment of posttraumatic and focal osteoarthritic cartilage defects of the knee with autologous polymer-based three-dimensional chondrocyte grafts: 2-year clinical results. Arthritis research & therapy.
2007;
9
(2)
:
R41
.
View Article PubMed Google Scholar -
Vinatier
C.,
Guicheux
J.,
Cartilage tissue engineering: From biomaterials and stem cells to osteoarthritis treatments. Annals of Physical and Rehabilitation Medicine.
2016;
59
(3)
:
139-144
.
View Article PubMed Google Scholar -
Steinwachs
M.R.,
Waibl
B.,
Mumme
M.,
Arthroscopic treatment of cartilage lesions with microfracture and BST-CarGel. Arthroscopy techniques.
2014;
3
(3)
:
e399-e402
.
View Article PubMed Google Scholar -
Tzanakakis
E.S.,
Hansen
L.K.,
Hu
W.S.,
The role of actin filaments and microtubules in hepatocyte spheroid self‐assembly. Cell motility and the cytoskeleton.
2001;
48
(3)
:
175-189
.
View Article Google Scholar -
Sart
S.,
Tsai
A.C.,
Li
Y.,
Ma
T.,
Three-dimensional aggregates of mesenchymal stem cells: cellular mechanisms, biological properties, and applications. Tissue Engineering Part B: Reviews.
2014;
20
(5)
:
365-380
.
View Article PubMed Google Scholar -
Pham
Phuc,
Vu
Ngoc Bich,
Phan
Nhan Lu-Chinh,
Le
Dung Minh,
Truong
Nhat Chau,
Truong
Nhung Hai,
Bui
Khanh Hong-Thien,
Phan
Ngoc Kim,
Good manufacturing practice-compliant isolation and culture of human adipose derived stem cells. Biomedical Research and Therapy.
2014;
4
(1)
:
1-9
.
-
The ISfCTps: Minimal criteria for defining multipotent mesenchymal stromal cells. Cytotherapy.
2006;
8
(4)
:
315-317
.
View Article PubMed Google Scholar -
Livak
Kenneth J,
Schmittgen
Thomas D,
Analysis of relative gene expression data using real-time quantitative PCR and the 2- $Δ$$Δ$CT method. methods.
2001;
25
(4)
:
402-408
.
-
Camp
C.L.,
Stuart
M.J.,
Krych
A.J.,
Current concepts of articular cartilage restoration techniques in the knee. Sports health.
2014;
6
(3)
:
265-273
.
View Article PubMed Google Scholar -
Murphy
K.C.,
Hung
B.P.,
Browne-Bourne
S.,
Zhou
D.,
Yeung
J.,
Genetos
D.C.,
Leach
J.K. ,
Measurement of oxygen tension within mesenchymal stem cell spheroids. Journal of the Royal Society, Interface.
2017;
14
(127)
.
View Article PubMed Google Scholar -
Cui
X.,
Hartanto
Y.,
Zhang
H.,
Advances in multicellular spheroids formation. Journal of the Royal Society, Interface.
2017;
14
(127)
.
View Article PubMed Google Scholar -
Murphy
K.C.,
Fang
S.Y.,
Leach
J.K.,
Human mesenchymal stem cell spheroids in fibrin hydrogels exhibit improved cell survival and potential for bone healing. Cell and tissue research.
2014;
357
(1)
:
91-99
.
View Article PubMed Google Scholar -
Gentili
C.,
Cancedda
R.,
Cartilage and bone extracellular matrix. Current pharmaceutical design. 2009;
15
(12)
:
1334-1348
.
View Article PubMed Google Scholar -
DeLise
A.M.,
Fischer
L.,
Tuan
R.S.,
Cellular interactions and signaling in cartilage development. Osteoarthritis and Cartilage.
2000;
8
(5)
:
309-334
.
View Article PubMed Google Scholar -
Kiani
C.,
Chen
L.,
Wu
Y.J.,
Yee
A.J.,
Yang
B.B.,
Structure and function of aggrecan. Cell research.
2002;
12
(1)
:
19-32
.
View Article PubMed Google Scholar -
Futrega
K.,
Palmer
J.S.,
Kinney
M.,
Lott
W.B.,
Ungrin
M.D.,
Zandstra
P.W.,
Doran
M.R.,
The microwell-mesh: A novel device and protocol for the high throughput manufacturing of cartilage microtissues. Biomaterials.
2015;
62
:
1-12
.
View Article PubMed Google Scholar -
Iozzo
R.V.,
Proteoglycans: structure, biology and molecular interactions. CRC Press.
2000
.
View Article Google Scholar -
Comper
W.D.,
Laurent
T.C.,
Physiological function of connective tissue polysaccharides. Physiological reviews.
1978;
58
(1)
:
255-315
.
View Article PubMed Google Scholar -
Hascall
V.C.,
Proteoglycans : The chondroitin sulfate/keratan sulfate proteoglycan of cartilage. ISI Atlas Sci Biochem.
1988
.
-
Rosenberg
L.,
Hellmann
W.,
Kleinschmidt
A.K.,
Macromolecular models of proteinpolysaccharides from bovine nasal cartilage based on electron microscopic studies. The Journal of biological chemistry.
1970;
245
(16)
:
4123-4130
.
-
Li
F.,
Truong
V.X.,
Fisch
P.,
Levinson
C.,
Glattauer
V.,
Zenobi-Wong
M.,
Thissen
H.,
Forsythe
J.S.,
Frith
Cartilage tissue formation through assembly of microgels containing mesenchymal stem cells. Acta biomaterialia.
2018;
77
:
48-62
.
View Article PubMed Google Scholar -
Bjornsson
S.,
Quantitation of proteoglycans as glycosaminoglycans in biological fluids using an alcian blue dot blot analysis. Analytical biochemistry.
1998;
256
(2)
:
229-237
.
View Article PubMed Google Scholar -
Scott
J.E.,
Quintarelli
G.,
Dellovo
M.C.,
The chemical and histochemical properties of Alcian Blue. I. The mechanism of Alcian Blue staining. Histochemie Histochemistry Histochimie.
1964;
4
(2)
:
73-85
.
View Article PubMed Google Scholar -
Kraan
P.M.,
Lange
J.,
Vitters
E.L.,
Beuningen
H.M.,
Osch
G.J.,
Lent
P.L.,
Berg
W.B.,
Analysis of changes in proteoglycan content in murine articular cartilage using image analysis. Osteoarthritis Cartilage.
1994;
2
(3)
:
207-214
.
-
Gao
L.,
Orth
P.,
Cucchiarini
M.,
Madry
H.,
Effects of solid acellular type-I/III collagen biomaterials on in vitro and in vivo chondrogenesis of mesenchymal stem cells. Expert review of medical devices.
2017;
14
(9)
:
717-732
.
View Article PubMed Google Scholar -
S.T.G. MONIQUE ADOLPHE,
DEMIGNOT
S.,
Chondrocyte Culture: A Target System to Evaluate: Pharmacotoxicological Effects of Drugs. In Vitro Methods in Pharmaceutical Research.
1997;
:
181-207
.
View Article Google Scholar
Comments
Downloads
Article Details
Volume & Issue : Vol 7 No 4 (2020)
Page No.: 3697-3708
Published on: 2020-04-26
Citations
Copyrights & License
This work is licensed under a Creative Commons Attribution 4.0 International License.
Search Panel
Pubmed
Google Scholar
Pubmed
Google Scholar
Pubmed
Google Scholar
Pubmed
Google Scholar
Pubmed
Google Scholar
Pubmed
Google Scholar
Pubmed
Search for this article in:
Google Scholar
Researchgate
- HTML viewed - 8850 times
- Download PDF downloaded - 1721 times
- View Article downloaded - 0 times
