

Copyrights: Hamed A. Abosharaf, Mohammed Salah, Thoria Diab, Motonari Tsubaki, Tarek M. Mohamed, 2020. License: This work is licensed under a Creative Commons Attribution 4.0 International License.
Abstract
Introduction: Plant-mediated synthesis of silver nanoparticles (AgNPs) is accounted as an ecofriendly process. The present study was conducted to estimate the potency of biogenic AgNPs against Ehrlich ascites carcinoma (EAC) cells in vitro and EAC-bearing mice in vivo.
Methods: AgNPs were prepared using mango leaves extract and characterized by X-ray diffraction (XRD), scanning electron microscope (SEM), and transmission electron microscopy (TEM). Ehrlich ascites carcinoma (EAC) mouse model was established by intraperitoneal injection of 1 x 10⁶ EAC cells. Biogenic AgNPs- alone or combined with Doxorubicin (DOX)- was administered intraperitoneally day by day for two weeks.
Results: Biologically synthesized AgNPs showed a cytotoxic effect against cultured EAC cells but with less toxicity toward normal cells compared to DOX, which had strong cytotoxicity against both cells. Biogenic AgNPs alone or combined with DOX triggered the cytotoxicity against the EAC-bearing mouse model via decreasing body weight, tumor volume, and the number of viable tumor cells. The combined treatment (AgNPs-DOX) ameliorated the drastic effect induced by injection of EAC cells through improving liver and kidney functions compared to those treated with DOX alone. In addition, the combined treatment showed an elevation in the expression of Bax and caspase-3, and a reduction in the expression of Bcl-2 protein in the EAC cells. Furthermore, this combined treatment effectively arrested the cell cycle at the G0/G1 phase. Moreover, the combined treatment with AgNPs-DOX caused a significant reduction in the activity of ornithine decarboxylase (ODC).
Conclusion: These findings suggest that biogenic AgNPs could be useful in developing a potent combination therapy against different types of cancers.
Introduction
Several novel anti-cancer drugs were designed, produced, and utilized for various clinical purposes. However, cancer remains the first danger facing our daily life1. In the previous decades, extensive research was devoted to discovering more sustainable anti-cancer drugs with the lowest side effects2, 3. Recently, a new strategy called nanotechnology has opened the gate to attracting more attention to research studies in the field of cancer therapy4.
The fundamental element of nanotechnology is nanoparticles. The size of the nanoparticles ranges between 1 and 100 nm. Moreover, the nanoparticles have unique physical, chemical, and biological properties due to their nanoscale size compared to their corresponding particles with larger scales5, 6. In particular, metal nanoparticles have been found as the most promising targets of various scientific challenges due to their versatile applications in many fields, such as electronics, biomedical applications, materials science, and environmental remediation. Among these metal nanoparticles, silver nanoparticles (AgNPs) are very unique due to their anti-microbial and anti-cancer activities7.
Silver nanoparticles can be prepared by various physical, chemical, and biological methods. Interestingly, the properties of the silver nanoparticles depend on the synthesis method. Biological synthetic methods are gaining huge interest because hazardous chemicals are not used in the synthesis7, 8. Some antioxidant compounds in plants can well react with silver salts, leading to the production of nanoparticles of silver under controlled reaction conditions which are eco-friendly and cheaper methods for their production in large scale. Interestingly, the plant antioxidant components act as reducing, stabilizing, and capping agents; therefore, additional chemicals are not required during the synthetic process. Furthermore, it is expected that plant-extracted components may enhance the therapeutic action via the synergistic effect with AgNPs9, 10. AgNPs are widely involved in numerous commercial products such as plastics, food, and textiles. In medicine, AgNPs have been reported to have cytotoxicity against various cancer cells11 but their actual mechanisms are still unclear. Therefore, many researchers have attempted to clarify the precise mechanisms of AgNPs cytotoxicity both in vitro and in vivo.
Mango trees (Mangifera indica) have attracted the interest of many researchers due to their anti-oxidant and anti-bacterial properties12. Moreover, phytochemical studies of the leaves of Mangifera indica have demonstrated the presence of phenols, saponins, tannins, steroids, flavonoids, and glycosides13. A previous study indicated a very high content of mangiferin, a polyphenolic compound, in ethanolic extraction prepared from mango leaves14. Mangiferin can act as a reducing agent in the production of silver nanoparticles. Additionally, it may also act as a stabilizing and capping agent for the synthesized AgNPs, leading to the enhancement of the anti-tumor activity15.
The present study aimed to prepare stable and eco-friendly AgNPs using biological methods and to evaluate the potency of AgNPs against Ehrlich ascites carcinoma (EAC) in a murine model.
Materials — Methods
Materials
Fresh leaves of mango were collected from a local farm, Tanta city, Egypt. Silver nitrate, 3(4,5-dimethylthiazol-2-yl)-2,5-diphenyltetrazolium bromide (MTT), thiobarbituric acid (TBA), trichloroacetic acid (TCA), 1-chloro-2,4 dinitrobenzene (CDNB), 5,5'- dithiobis 2- nitrobenzoic acid (DTNB), and reduced glutathione (GSH) were purchased from Sigma-Aldrich (St. Louis, MO, USA). Doxorubicin (2 mg/mL) was purchased from EIMC United Pharmaceutics (Cairo, Egypt). All reagents were of the highest analytical grade.
Experiments
Preparation of silver nanoparticles
Preparation of mango leaves extract
Collected mango leaves were washed several times with tap water followed by washing twice by distilled water to remove the dust particles; then, they were sun-dried until the color turned to brown. The dried leaves were powdered and 15 g of the powdered leaves was mixed with 150 mL of 50% ethanol for 24 h in a dark place with occasional agitation at room temperature. The ethanolic extract was stored at room temperature until use15.
Synthesis of silver nanoparticles
Ethanolic mango leaves extract was incubated with 1 mM silver nitrate solution at 37 °C for 24 h. The color changed from colorless to yellowish-brown, indicating the formation of silver nanoparticles. Then, the mixture was centrifuged at 10,000 rpm for 10 min. The collected pellets were washed several times with Milli-Q water and the precipitates were dried at room temperature15.
Characterization of silver nanoparticles
UV–Vis spectrophotometric analysis
An aqueous dispersion of the dried sediment was prepared and its UV-visible absorption spectrum was recorded by scanning between 300–800 nm with a Shimadzu-1800 UV-visible spectrophotometer to confirm the presence of silver nanoparticles8.
Scanning electron microscopy
The surface morphological features of the nanoparticles were analyzed by scanning electron microscopy (SEM) according to Jores et al.16. The samples were placed on a copper grid for SEM, coated with carbon, and subjected to SEM for analysis by using JEOL JSM-IT100 (JEOL, Tokyo, Japan).
Transmission electron microscopy
Distribution of the shape and the size of the synthesized silver nanoparticles were characterized by transmission electron microscopy (TEM). The sample was placed on a copper grid coated with carbon and was subjected to TEM analysis by using a JEOL JEM-2100F (JEOL, Tokyo, Japan)17.
X-ray diffraction analysis
X-ray diffraction (XRD) analysis was carried out by using an X-ray diffractometer (GNR APD2000 Pro, Italy) following the method of El-Naggar et al. (10). The diffractometer was operated at a voltage of 40 kV and a current of 30 mA with CuKα radiation (1.5405 Å). The X-ray data were recorded in the range from 4° to 90° 2 θ with a continuous scanning mode with a scanning speed of 8° /min. The crystalline size of the AgNPs was analyzed by using Debye–Scherrer equation18,
Where D is the grain size, λ is the wavelength of X-ray (1.54056 Å), and β is the full width at half maxima of the diffraction peak (in radians).
Cell culture conditions
EAC cells and WISH cells were cultured in Dulbecco’s Modified Eagle Medium (DMEM) with high glucose (4.5 g/L) and containing 10 % fetal bovine serum (FBS) (Gibco-BRL, New York, USA) at 37 °C and 5% CO2. All cells were provided by the National Cancer Institute, Cairo University, Egypt.
Cell viability and proliferation assays
3‑(4,5‑dimethyl‑2‑thiazolyl)‑2,5‑diphenyl‑2‑H‑tetrazolium bromide (MTT) assay was performed according to Siddiqui et al.19. Briefly, EAC cells were seeded in 96-well plates (1 x 10⁴ cells/well) and incubated at 37 °C for 24 h. After cell attachment, the cells were treated with different concentrations of AgNPs and Doxorubicin (DOX) for 48 h. After the incubation, 200 µL of 0.5 mg/mL of MTT reagent (Gibco-BRL) was added to each well and allowed to sit for 4 h. Then, DMSO was added to dissolve the formazan crystals formed from the MTT reagent, and the absorbance at 570 nm was measured using a Model 680 microplate reader (Bio-Rad, California, USA). For proliferation rate analysis, the EAC cells were plated in 6-well plates at a density of 5x10⁵ cells per well, and incubated with 40 µg/mL and 2.5 µg/mL of AgNPs and DOX, respectively, for 48 h. Then, the cells were detached and living cells stained by trypan blue. The number of viable cells was measured using a TC 10 automated cell counter (Bio-Rad).
In vivo toxicity protocol
Sixty female Swiss Albino mice, weighing 20 – 25 g, were purchased from the National Cancer Institute (Cairo, Egypt). Animal handling and all experimental designs were approved by the Research Ethical Committee, Faculty of Science, Tanta University (Egypt), following the international guidelines for animal care and use of laboratory animals avoiding any stress20, 21. Mice were divided into six groups (n = 10): control group (mice were injected with an isotonic solution during the experiment), and AgNPs group (mice were injected with AgNPs (10 mg/kg body weight) intraperitoneally (IP) day by day during the experiment). The remaining mice (n = 40) were firstly injected with 1 x 10⁶ EAC cells/mouse and then divided into the rest of the four groups: tumor-bearing mice (EAC group), Doxorubicin-treated group (EAC + DOX group) whereby mice were treated with doxorubicin (2 mg/kg body weight, IP injection) day by day, AgNPs-treated group (EAC + AgNPs group) whereby mice were treated with AgNPs (10 mg/kg body weight IP injection) day by day, and the combination group (EAC + DOX + AgNPs) whereby mice were treated with AgNPs and DOX (10 and 2 mg/kg body weight, respectively). After two weeks, all mice were anesthetized with ether and euthanized. EAC cells were withdrawn from the peritoneal cavity and serum; additionally, tissue samples were collected for further analysis10, 22.
Serum liver and kidney functions tests
Liver and kidney functions were evaluated by measuring the activities of serum aspartate aminotransferase (AST) (by using GOT (AST) Glutamic – Oxaloacetic Transaminase kit) and of alanine aminotransferase (ALT) (by using GPT (ALT) Glutamic – Pyruvic Transaminase kit). The concentration of albumin (using an albumin colorimetric kit), urea (using an urea kit), and creatinine were also assessed; all these kits were purchased from the Biodiagnostic Company (Giza, Egypt)23, 24.
Oxidative stress assays
Measurement of hepatic and renal reduced glutathione
The concentration of reduced glutathione (GSH) was estimated according to Ellman 25. In brief, 50 µL of the tissue homogenates were mixed with DTNB buffer (0.1 M sodium phosphate and 1 mM EDTA, pH 7.5) and 250 µL of 40% of DTNB. Then, the absorbance was measured at 412 nm. GSH concentration was calculated as µmol/g of tissue using a standard curve.
Measurement of hepatic and renal glutathione S-transferase activity
The activity of glutathione S-transferase (GST) was measured spectrophotometrically according to Habig et al.26. The reaction was initiated by mixing 100 µL of the tissue homogenates with 50 mM KPO4 (pH 6.5), 0.4 mM 1-chloro-2,4-dinitrobenzene (CDNB), and 5 mM GSH in a quartz cuvette. The enzymatic formation was monitored at 340 nm (ε340 = 9.6 mM−1 cm−1) for one minute after the addition and corrected for controls.
Measurement of hepatic and renal glutathione peroxidase activity
Glutathione peroxidase (GPx) activity was determined based on Rotruck et al. 27. In brief, 0.2 mL of Tris-HCl buffer, 0.2 mL of EDTA solution, 0.1 mL of sodium azide solution, and 0.5 mL of the tissue homogenate were added and mixed well. To this mixture, 0.2 mL of GSH solution followed by 0.1 mL of H2O2 solution was added. The contents were mixed well and incubated at 37 °C for 10 min. The reaction was quenched by the addition of 0.5 mL of 10 % TCA and centrifuged at 3,000 rpm for 10 min. Then, 1 mL of the supernatant was withdrawn and mixed with 0.5 mL Ellman’s reagent and 3 mL phosphate buffer. The sample was kept at room temperature for 15 min and then the absorbance was read at 412 nm. The activity is expressed as µmol of GSH oxidized/min/g tissue using the standard curve.
Measurement of hepatic and renal catalase activities
The activity of catalase (CAT) was measured by the method described by Aebi 28. In brief, 10 µL of the tissue homogenates were mixed with 3 mL of 30 mM hydrogen peroxide (H2O2) in 50 mM phosphate buffer (pH 7) in a quartz cuvette. The decomposition of H2O2 was determined by the absorbance change at 240 nm (ε240 = 0.0394 mM-1 cm-1).
Measurement of hepatic and renal malonaldehyde activities
Malonaldehyde (MDA) level was measured according to Niehaus and Smuelsson 29. Briefly, 0.5 mL of 10 % of the tissue homogenates were shaken with 2.5 mL of TCA; then, the homogenates were centrifuged at 3,000 rpm for 10 min. Next, 2 mL of the supernatant was mixed with 1 mL of TBA and the mixture was boiled for 15 min followed by rapid cooling. Then, 4 mL of n-butyl alcohol was added, and after shaking, the tubes were centrifuged at 3,000 rpm for 10 min and the absorbance at 532 nm was measured. The amount of lipid peroxidation in the tissue can be expressed as nmol per g of issue using the value of ε532 = 156 mM-1cm-1.
Immunoblotting assay
Immunoblotting analysis was conducted based on the method of Towbin et al.30. The total protein was extracted from the cells by using ice-cold lysis buffer (10 mM Tris–HCl buffer, pH 7.4, containing 100 mM NaCl, 25 mM EDTA, 25 mM ethylene glycol bis(2-aminoethyl) tetraacetic acid (EGTA), 0.1 % sodium dodecyl sulfate (SDS), 1 % (v/v) Triton X-100, 2 % (v/v) NP-40, with 1: 200 protease inhibitor cocktail (Sigma-Aldrich) and 1:300 phosphatase inhibitor cocktail tablet (Roche, Indiana, USA). Total protein concentration was determined by a colorimetric Bradford assay. Equal amounts (20 µg) of protein samples were mixed and boiled with SDS loading buffer for 10 min, allowed to cool on ice, and then loaded onto 12% SDS-polyacrylamide gel and separated by a Cleaver electrophoresis unit (Cleaver, UK). Then, the separated protein bands were transferred onto polyvinylidene fluoride (PVDF) membranes (Bio-Rad) using a Semi-dry Electroblotter (Bio-Rad), at 2.5 A and 25 V for 30 min. Then the PVDF membrane was blocked with 5% nonfat dry milk in TBS-T buffer for 2 h at room temperature and samples were incubated with anti-BAX (1:1000; sc-20067), anti-Bcl-2 (1:1000; sc-23960), and anti-caspase-3 (1:1000; sc-56053) primary antibodies at 4°C overnight. Then, samples were incubated with goat anti-rabbit IgG-HRP secondary antibody (sc-2030; 1:1000). The chemiluminescent signals were captured using a Chemi Doc imager (Bio-Rad), the analysis of protein bands was carried out with Image J software, and the density of each band was normalized by β-actin (1:1000; sc-69879).
Flow cytometry measurements for cell cycle arrest
Cellular DNA content was analyzed using flow cytometry as previously described by Pozarowsk and Darzynkiewicz31. In brief, the EAC cells were washed with PBS and centrifuged, then fixed in 500 µL of 70% ice-cold ethanol for at least 2 h at 4 °C. The mixture was centrifuged at 1,000 rpm for 5 min to eliminate the ethanol. Later, the cells were washed with PBS and mixed with 500 µL of PI staining solution containing RNase, and incubated approximately for 30 min in the dark at room temperature. Finally, the samples were examined using an Accuri C6 flow cytometer (Becton Dickinson, New Jersey).
Measurements of apoptosis level by Annexin-V/PI staining
Analysis of apoptosis level was made using a FITC Annexin V Kit (Cat. No.556547; BD Pharmingen, USA). In short, the EAC cells were washed gently twice with ice-cold PBS and resuspended in 1X Annexin-binding buffer (1 x 10⁶cells/mL). Then, 5 μL of the Annexin V-FITC and 5 μL of PI were added to each of 100 μL of cell suspension. The cells were incubated for 15 min at room temperature (25 ºC) in the dark. Then, 400 μL of 1X Annexin-binding buffer was added. The samples were then analyzed by an Accuri C6 flow cytometer (Becton Dickinson), as previously described32.
Histopathological examination
Liver and kidney tissues were fixed (10% formalin), washed, and dehydrated by serial dilution of alcohol. Specimens were embedded in paraffin wax. Tissue blocks were prepared for sectioning at 4 µm thickness by sludge microtome. The obtained tissue sections were collected on glass slides, deparaffinized, and stained by hematoxylin and eosin for examination under light electric microscope 33.
Immunocytochemistry of ornithine decarboxylase (ODC)
Briefly, 1 x 10⁴ EAC cells were fixed with 4% paraformaldehyde for 10 minutes, then incubated with 10% FBS containing 0.1% Triton-X 100 for 15 minutes for blocking the unspecific binding, then treated with primary anti-ODC antibody (1:50; sc-398116; Santa Cruz Biotechnology, Inc., Texas, USA) overnight at 4°C. Samples were incubated with the secondary antibody at room temperature for 1 h, followed by incubation with 0.4% DAPI for 10 minutes. Images were captured by BZ-9000 fluorescence microscope (Keyence, Japan). Percent of ODC-positive cells were counted using ImageJ and statistically analyzed using GraphPad Prism software (La Jolla, CA) for one-way ANOVA with Tukey’s multiple comparison tests.
Statistical analysis
The present data were expressed as mean ± SD. All statistical analyses (e.g. one-way ANOVA followed by Tukey test) were carried out by GraphPad Prism software 8.0.1; P < 0.05 was recorded as a significant difference.
Results
Synthesis and characterization of mango leaves extract-derived AgNPs

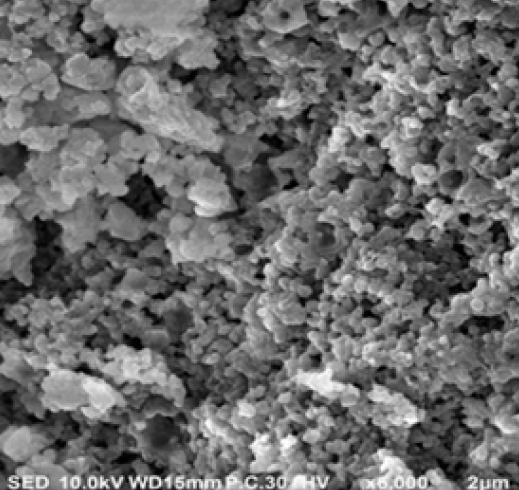
The change in color to dark brown upon incubation of the colorless silver nitrate solution with mango leaves extract indicated the formation of AgNPs by the reduction with plant anti-oxidant components. Further, the characteristic λ max of the suspension of AgNPs in the range of 300–800 nm was examined by using UV-visible absorption spectroscopy. The spectrum showed a distinct peak at 430 nm, as shown in Figure 1 A, which can be attributed to the surface plasmon effects of AgNPs. Then, the green-synthesized AgNPs' crystalline structure was determined by XRD measurements (Figure 1 B). Four distinct diffraction peaks of the synthesized AgNPs were observed (111, 200, 220, and 311, respectively). The average crystalline size of the AgNPs was calculated by using the Debye–Scherrer equation at 111 reflections and was estimated to be around 13.85 nm.
SEM and TEM were conducted to investigate the actual size and morphological structures of the synthesized AgNPs. The SEM image (Figure 1 C) illustrated that spherical and homogenous nanoparticles were formed. The TEM image (Figure 1 D) indicated that the sizes of AgNPs ranged from 9.12 to 20.95 nm, which were compatible with the results of our XRD measurements.
In vitro anti-cancer potency of mango leaves extract-derived AgNPs
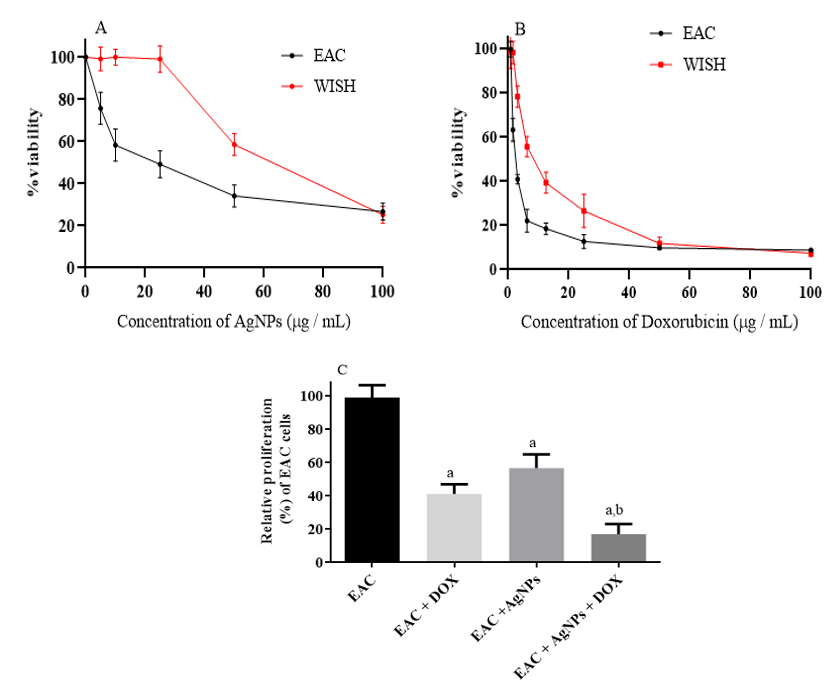
The cytotoxic effects of the biogenic AgNPs on cell proliferation was evaluated using WISH (normal cell line) and EAC cells, as illustrated in Figure 2 A. The results exhibited a concentration-dependent reduction in the viability of EAC cells upon addition of biogenic AgNPs. On the other hand, the biogenic AgNPs had no significant effect on WISH (normal cells) up to 25 µg/mL (Figure 2 A). In contrast, addition of DOX showed a highly cytotoxic effect against both WISH and EAC cells, as shown in Figure 2 B. Interestingly, the combination of AgNPs with DOX reduced the proliferation rate of EAC cells dramatically (Figure 2 C). This latter observation suggested that AgNPs might be a prospective combinatorial drug. Accordingly, we carried out in vivo studies to obtain more information.
In vivo anti-tumor activity of biogenic AgNPs in EAC model
To evaluate the efficacy of AgNPs as a monotherapy or in combination with DOX, an in vivo study was conducted. EAC cells were injected intraperitoneally into mice, and changes in the body weight, tumor volume, and tumor cell counts were determined. The results were summarized in Table 1. The body weight of the EAC-bearing group was significantly increased (p < 0.001; 1.3-fold) compared to the control group. Treatment using the biogenic AgNPs alone or in combination with DOX significantly decreased the body weight by 0.8-fold and 0.7-fold, respectively, in comparison to the non-treated EAC-bearing group.
| Group | Body weight at the start (g) | Body weight at the sacrifice (g) | Percentage of change in the body weight (%) |
| Control | 19.6 ± 6 | 21.9 ± 4.4 | 11.7 |
| AgNPs | 20.8 ± 5.8 | 22.6 ± 3.5 | 8.6 |
| EAC | 20.8 ± 2.3 | 28.6 ± 3.14 a | 37.5 |
| EAC + DOX | 22.68 ± 2.13 | 22.9 ± 0.7 b | 0.97 |
| EAC + AgNPs | 22.5 ± 2.5 | 24 ± 1.6 b | 6.6 |
| EAC + AgNPs + DOX | 21.9 ± 3.1 | 21.1 ± 0.59 b | - 3.5 |
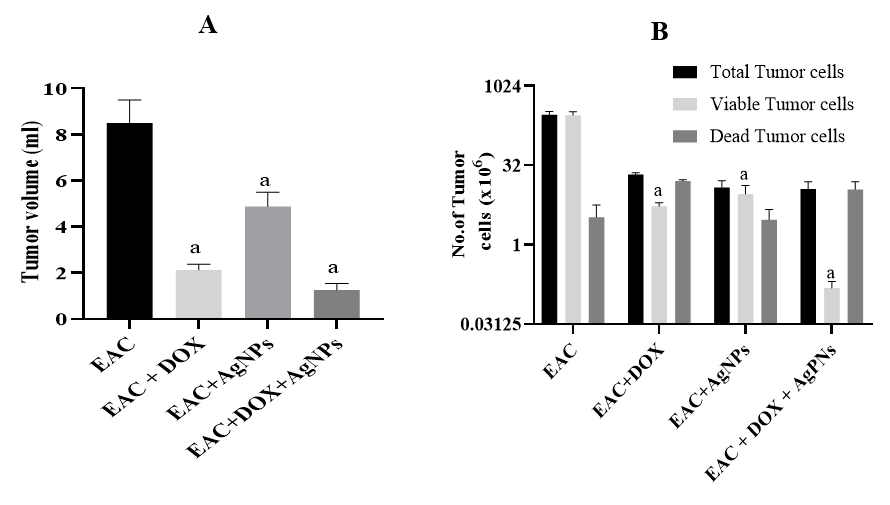
Moreover, AgNPs, DOX, or combined-treated groups showed not only a significant reduction in the ascetic volume (p < 0.0001) compared to the EAC-bearing group (Figure 3 A) but also in the total and viable cells (p < 0.0001), accompanied by a remarkable reduction in the non-viable cells with percent 24.4%, 74.9%, and 98.6%, respectively, compared to the EAC-bearing group (Figure 3 B).
Effect of biogenic AgNPs on liver and kidney functions in EAC-bearing mice
As shown in Table 2, we detected significant elevations in the levels of serum ALT, AST, urea, and creatinine, as well as an obvious reduction in the level of serum albumin, in EAC-treated group compared to the control mice group. These findings indicated significant disturbance in the liver and kidney functions upon transfusion of EAC. These functional changes were significantly suppressed by the combined AgNPs and DOX treatment compared to DOX-treatment alone.
| Groups | ALT (U/L) | AST (U/L) | Albumin (g/dL) | Urea (mg/dL) | Creatinine (mg/dL) |
| Control | 33.66 ± 5.1 | 88.83 ± 0.28 | 2.94 ± 0.05 | 41.3 ± 1.5 | 0.53 ± 0.02 |
| AgNPs | 37 ± 2 | 89.3 ± 0.76 | 2.966 ± 0.11 | 42 ± 2 | 0.54 ± 0.025 |
| EAC | 88.66 ± 5.1 a | 112.5 ± 2.17 a | 2.53 ± 0.45 | 52.66 ± 2.5 a | 0.67 ± 0.025 a |
| EAC + DOX | 94 ± 4.3 a,b | 118.16 ± 2 a,b | 2.1 ± 0.17 a,b | 80.3 ± 1.5 a,b | 0.9 ± 0.02 a,b |
| EAC + AgNPs | 47 ± 2 a,b,c | 100.2 ± 0.76 a,b,c | 2.5 ± 0.4 c | 47 ± 2 a,b,c | 0.646 ± 0.025 a,c |
| EAC + Dox + AgNPs | 55 ± 2 a,b,c | 101.6 ± 0.76 a,b,c | 2.7 ± 0.3 c | 48.3 ± 2.5 a,c | 0.656 ± 0.025 a,c |
Biogenic AgNPs enhance the antioxidant system in EAC model in vivo
EAC-bearing mice, as well as DOX-treated mice, showed a significant (p < 0.0001) reduction in the levels of antioxidant activity of GSH, GPx, GST, and catalase compared to those of control group (Figure 4). These reductions were rescued by AgNPs alone or in combination with DOX. On the other hand, the MDA level, as a marker of oxidative stress, was clearly elevated in EAC-bearing group and DOX-treated group compared to that of the control group ((p < 0.001 and p < 0.0001, respectively); MDA level was improved in AgNPs-treated group and AgNPs-DOX-treated group (p < 0.0001 and p < 0.05, respectively) compared to that of the EAC-bearing group treated with DOX alone.

Induction of apoptosis and cell cycle arrest by biogenic AgNPs in EAC-bearing mouse model
Induction of apoptosis in EAC cells in the EAC-bearing mice model was tested by detecting the expression levels of caspase-3 and Bax proteins in differently treated groups. A remarkable up-regulation of caspase-3 and Bax was detected in all of the treated groups, with the EAC-bearing group with combined treatment showing the highest levels (Figure 5 A). On the other hand, the expression of anti-apoptotic Bcl-2 protein was extremely down-regulated in all of the treated EAC-bearing groups. Furthermore, the combined treatment showed enhanced reduction (Figure 5 A).
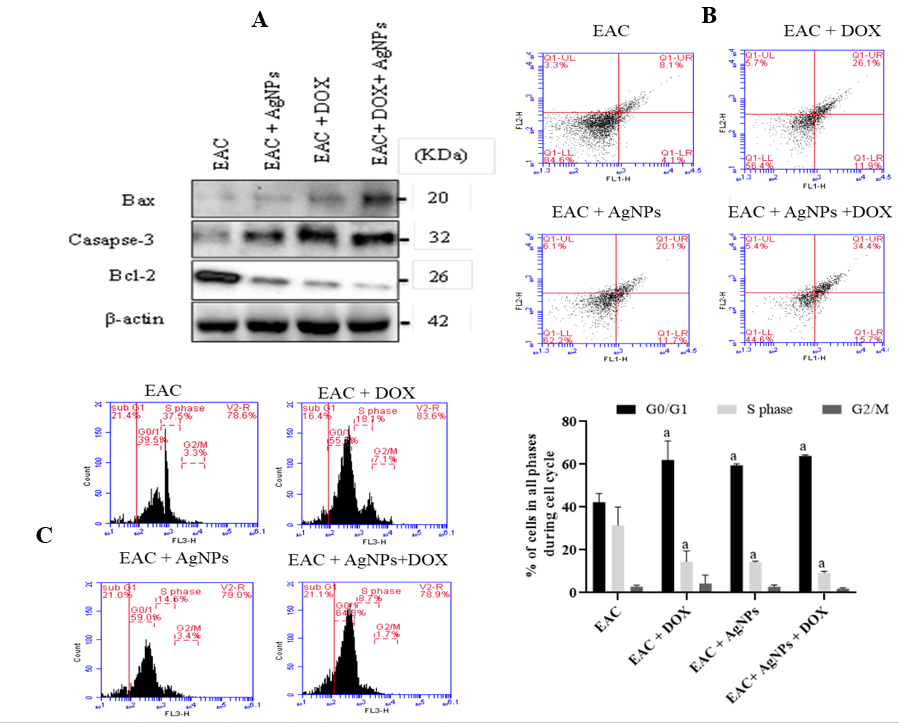
By analyzing annexin-V/PI staining in the EAC-bearing mice model using flow cytometry, treatment with AgNPs or DOX, and the combined treatment, showed an elevation in annexin-V/PI-positive cells (20.1%, 26.1%, and 34.4%, respectively) compared to the EAC-bearing group without the treatment (8.1%). Among them, the combined treatment with AgNPs-DOX exhibited the highest apoptotic cells, indicating the efficacy of the combined treatment in EAC-bearing mice (Figure 5 B).
Furthermore, cell cycle arrest was tested in the differently treated groups and showed a significant Go/G1 cell arrest in all of the treated groups compared to the EAC-bearing group (p < 0.01). The S phase population was found to be significantly (p < 0.01) decreased compared to those in the EAC-bearing group. No detectable changes were observed between the differently treated groups in terms of cell population at G2/M phase (Figure 5 C).
Effects of the different treatments on the microscopic features of hepatic and renal tissues induced in the EAC-bearing mice

In our study, we found that EAC-bearing mice showed massive inflammatory cells infiltration, parenchymatous degeneration, and focal necrosis in the hepatocytes of the hepatic tissue (Figure 6 IC). These damages were noted in the renal tissue where a thickening of the renal capsule, focal inflammatory cells, degeneration, and coagulative necrosis tubules around the cortex were detected (Figure 6 IIC). The hepatic tissue of the DOX-treated group showed a noticeable thickening and inflammatory cell infiltration associated with degeneration, besides the potent congestion in the portal vein (Figure 6 ID). Further, the renal tissue displayed obvious congestion in the cortical blood vessels as well as necrobiotic features (Figure 6 IID). These unusual morphological changes observed for the EAC-bearing group were ameliorated upon the combined treatment with AgNPs and DOX, showing a normal portal vein with fewer hepatocytes and renal tubular degeneration (Figure 6 IF and Figure 6 IIF). On the other hand, AgNPs-treated group, as well as the control group, showed normal histological structures.
Effects of the different treatments on ODC level in EAC-bearing mice
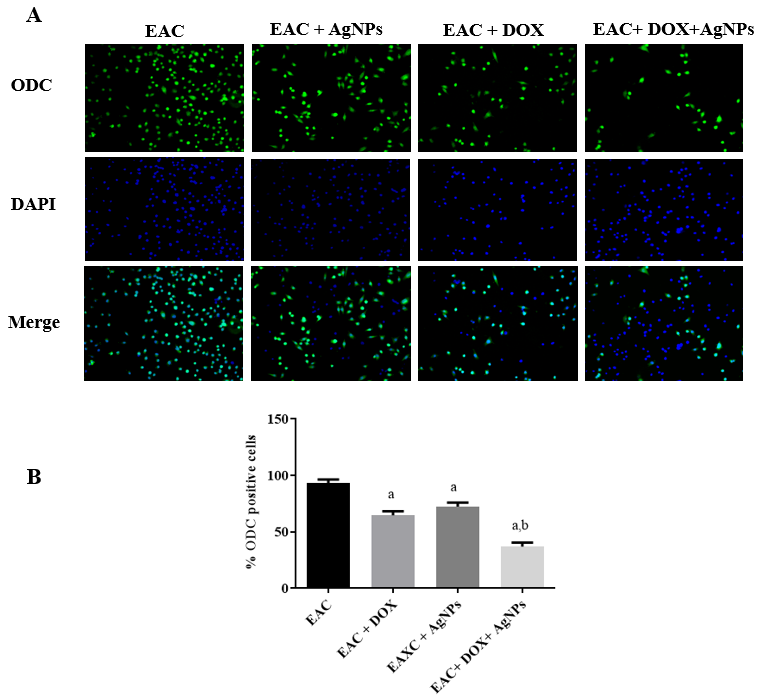
Immunocytochemical measurement was used to detect ODC level in the extracted EAC cells from the EAC-bearing mice after the treatment with AgNPs alone or in combination with DOX (Figure 7 A). As shown in Figure 7 B, AgNPs- and DOX-treated cells displayed a remarkable reduction in ODC-positive cells. Furthermore, the combined treatment of AgNPs and DOX showed a stronger reduction in ODC-expressing cells, compared to the non-treated group.
Discussion
In the current study, we attempted to utilize possible cytotoxic effects of the biologically synthesized AgNPs on the targeted EAC cells. Using aqueous mango leaves extract, we found that the antioxidant-rich plants may have a pivotal role in the reduction of silver to form minute yellow-brown AgNPs. The characteristics of our biogenic AgNPs were confirmed by measuring XRD, SEM, and TEM as previously described15, 20, 34, 35.
AgNPs are known to show potent cytotoxicity to cancer tissues compared to normal tissues. In the present research study, we detected that our AgNPs at different concentrations up to 25 µg/mL dramatically suppressed the viability of EAC cells but not that of normal control cells. On the other hand, DOX, a commercially available reagent for chemotherapy, showed a harmful effect on both normal and cancer cells. Next, we monitored the cellular proliferation rate of EAC cells by tracking their growth rate for 48 hours. Although the usage of each of AgNPs or DOX alone successfully reduced the number of proliferating EAC cells to about 50 %, the combined treatment with AgNPs and DOX killed more than 80% of EAC cells, suggesting the augmented effect of AgNPs to the cytotoxic ability of DOX. A recent study showed that synthesized AgNPs from Tamarindus indica tree exhibited a cytotoxic effect against breast cancer cells36; the study found that 20 µg/mL could inhibit 50% of the MCF-7 cells. These results and ours indicate that the AgNPs prepared by different biogenic methods may have a strong anti-tumor effect on different malignancies.
Our biogenic AgNPs showed an excellent ability to augment the anti-tumor potency of DOX against EAC bearing-mice and reduced its displeasing effects. Our results demonstrated the effective role of different treatments in the reduction of abdominal inflammatory exudates and viable cells as well, that were formed following the injection of EAC cells intraperitoneally in the tested mice. Such reduction was reflected as the loss of body weight in the mice. The combined treatment potentially contributed to the loss of body weight in the EAC-bearing mice and minimized the number of viable EAC cells. Our findings were similar to those of El-Naggar et al.10 who suggested that the treatment of EAC-bearing mice with AgNPs at a dose of 5 mg/kg body weight significantly inhibited the expansion in tumor cell volume and any increases in tumor cell count and tumor weight.
The administration of AgNPs lessened the side effects induced by the injection of EAC cells via augmenting the liver and kidney functions and controlling the oxidative stress in the body. Our findings showed an unfavorable excess in the level of liver enzymes (including ALT and AST) with a reduction in the serum albumin level, as well as increase in creatinine and urea as markers of kidney function. These parameters were markedly controlled after the combined administration of AgNPs and DOX. Furthermore, the hepatic and renal levels of antioxidants, such as GSH, GPX, GST, and catalase, were decreased for the EAC-bearing group and the DOX-treated group compared to the control. Interestingly, administration of AgNPs alone or combined with DOX caused an elevation of anti-oxidant parameters in both kidney and liver tissues compared to those of the EAC-bearing and DOX-treated groups. MDA, an oxidative stress marker, was found to be at the lowest level in the DOX-AgNPs-treated group compared to the EAC-bearing and the DOX treated groups. Previous studies have suggested that the combined treatment with biologically-synthesized AgNPs with different types of agents used for chemotherapy not only controlled the liver and kidney functions but also enhanced the antioxidant contents in EAC-bearing mice37, 38. Our present results indicated that non-toxic effects of AgNPs on various body organs were evident and that AgNPs also possess potent antioxidant activity which might be considered as a crucial mechanism for eradicating several types of cancer cells.
We found that biologically synthesized AgNPs induced apoptosis and cell cycle arrest of EAC cells through up-regulation of pro-apoptotic Bax and caspase-3 genes and down-regulation of the anti-apoptotic Bcl-2 gene. These responses were noticed in DOX- and AgNPs-treated groups; the apoptotic effects were clearly visualized after a combination of nanomedicine and chemotherapy. Further, these findings were confirmed via annexin-V/PI staining. Moreover, treatment with AgNPs augmented the efficacy of DOX therapy by controlling the cell cycle through the massive increase in Go/G1 population, indicating that the cell cycle arrest functions as a prominent step in the apoptosis pathway. On the pathological level, usage of AgNPs or DOX might lessen the lesions in liver and kidney tissues, while usage of AgNPs and DOX in a combined manner prominently rescued the damaged hepatic and renal tissues. AgNPs treatment, especially at high doses, is known to cause severe necrotic areas in the tumor tissue23. According to a previous study39, the cytotoxicity of AgNPs was related to their capacity to be dissolved and released as silver ions in cells. There is a great possibility that the released silver ions may accumulate in the mitochondria and nucleus, thereby promoting the generation of reactive oxygen species (ROS) and trigger oxidative stress which would cause DNA damage and cell apoptosis. Our data are in great accordance with the results of Al-Sheddi et al.40 who indicated that the biosynthesized AgNPs induced cell death in HeLa cells. Furthermore, a recent study suggested that the released silver ions from AgNPs mainly exist as free cations which can interact with cell membranes that are rich in negative charges, causing cell membrane depolarization and, finally, leading to cell necrosis. They also proposed that this process is induced by Ca+2 and Na+ influx41.
Polyamines play an essential role in cell growth, proliferation, and tumor development. Elevations of ODC activity and polyamine content in cancer cells were considered as a marker of poor prognosis as previously reported42, 43. Our data showed that all EAC-treated groups reduced the expression of ODC in EAC cells, and that a combination of AgNPs and DOX showed a progressive reduction in ODC and polyamine expressions in EAC cells. Our data were in accordance with those of Geck et al.44 who suggested that cisplatin and DOX inhibited polyamine via the suppression of ODC activity in MDA-MB-468 and SUM-159PT cells. Our data showed that the anti-tumor activity of biogenic AgNPs is due to their inhibitory effect against ODC in tumor cells.
Conclusions
In conclusion, the usage of mango leaves extract is considered as a simple, biomimetic, cost-effective, and stable preparation method for the production of AgNPs. These biogenic synthesized AgNPs demonstrated an excellent anti-cancer potency in an EAC tumor-bearing mouse model via their apoptotic effects and via inhibition of ODC activity. Based on these data, our biogenic silver nanoparticles might be an effective and prominent agent in the field of nanomedicine and cancer therapy.
Abbreviations
AgNPs: Silver nanoparticles
DOX: Doxorubicin
EAC: Ehrlich ascites carcinoma
ODC: ornithine decarboxylase
XRD: X-ray diffraction
Acknowledgments
We thank Dr. Aliaa Radwan, Biochemistry Division, Chemistry Department, Faculty of Science, Tanta University for her valuable help in the Invivo experiments and data analysis.
Author’s contributions
Hamed A. Abosharaf: Investigation, Methodology, Formal analysis, Writing an original draft. Mohammed Salah: Methodology, Investigation, writing editing. Thoria Diab: Supervision, Investigation. Motonari Tsubaki: Conceptualization, Supervision, Writing-review, and writing editing. Tarek M. Mohamed: Conceptualization, Supervision, Writing-review, and writing editing. All authors read and approved the final manuscript.
Funding
None.
Availability of data and materials
Data and materials used and/or analyzed during the current study are available from the corresponding author on reasonable request.
Ethics approval and consent to participate
All experimental design were approved by the Research Ethical Committee, Faculty of Science, Tanta University, Egypt following the international guidelines for animal care and use of laboratory animals.
Consent for publication
Not applicable.
Competing interests
The authors declare that they have no competing interests.
References
-
Cour
K.L.,
Johannessen
H.,
Josephsson
S.,
Activity and meaning making in the everyday lives of people with advanced cancer. Palliative & supportive care.
2009;
7
(4)
:
469 -479
.
View Article PubMed Google Scholar -
Qi
S.,
Sun
J.,
Yu
S.,
Co-delivery nanoparticles of anti-cancer drugs for improving chemotherapy efficacy. Drug delivery.
2017;
24
(1)
:
1909-1926
.
View Article PubMed Google Scholar -
Adahoun
M. A.,
Al-Akhras
M. H.,
Jaafar
M. S.,
Bououdina
M.,
Enhanced anti-cancer and antimicrobial activities of curcumin nanoparticles. Artificial Cells, Nanomedicine, and Biotechnology.
2017;
45
(1)
:
98-107
.
View Article PubMed Google Scholar -
Hasan
S.,
A review on nanoparticles: their synthesis and types. Research Journal of Recent Sciences.
2015;
4
(ISC-2014)
:
9-11
.
-
Machado
S.,
Pacheco
J. G.,
Nouws
H. P. A.,
Albergaria
J. T.,
Delerue-Matos
C.,
Characterization of green zero-valent iron nanoparticles produced with tree leaf extracts. Science of The Total Environment.
2015;
533
:
76-81
.
View Article PubMed Google Scholar -
Pal
S.L.,
Jana
U.,
Manna
P.K.,
Mohanta
G.P.,
Manavalan
R.,
Nanoparticle: An overview of preparation and characterization. Journal of applied pharmaceutical science.
2011;
1
(6)
:
228-234
.
-
Iravani
S.,
Green synthesis of metal nanoparticles using plants. Green Chemistry.
2011;
13
:
2638-2650
.
View Article Google Scholar -
Korbekandi
H.,
Ashari
Z.,
Iravani
S.,
Abbasi
S.,
Optimization of biological synthesis of silver nanoparticles using Fusarium oxysporum. Iranian journal of pharmaceutical research.
2013;
12
(3)
:
289-298
.
PubMed Google Scholar -
Makarov
V. V.,
Love
A. J.,
Makarova
S. S.,
Yaminsky
I. V.,
Kalinina
N. O.,
"Green" nanotechnologies: synthesis of metal nanoparticles using plants. Acta Naturae (англоязычная версия).
2014;
6
(1)
:
35-44
.
View Article PubMed Google Scholar -
El-Naggar
N.E.A.,
Hussein
M. H.,
El-Sawah
A. A.,
Bio-fabrication of silver nanoparticles by phycocyanin, characterization, in vitro anticancer activity against breast cancer cell line and in vivo cytotxicity. Scientific Reports.
2017;
7
(1)
:
10844
.
View Article PubMed Google Scholar -
Conde
J.,
Doria
G.,
Baptista
P.,
Noble metal nanoparticles applications in cancer. J Drug Deliv.
2012;
2012
:
751075
.
View Article PubMed Google Scholar -
Jhaumeer
L.S.,
Bhowon
M.G.,
Soyfoo
S.,
Chua
L.S.,
Nutritional and Biological Evaluation of Leaves of Mangifera indica from Mauritius. Journal of Chemistry.
2018;
2018
:
6869294
.
View Article Google Scholar -
Somkuwar
D.O.,
Kamble
V.A.,
Phytochemical screening of ethanolic extracts of stem, leaves, flower and seed kernel of Mangifera indica L. Int. J. Pharm. Bio. Sci.
2013;
4
(2)
:
383-389
.
-
Fernández-Ponce
M.T.,
Casas
L.,
Mantell
C.,
Ossa
E.J.M.,
Potential use of mango leaves extracts obtained by high pressure technologies in cosmetic, pharmaceutics and food industries. Chemical Engineering Transactions.
2013;
32
:
1147-1152
.
View Article Google Scholar -
Anoop
N.V.,
Jacob
R.,
Paulson
J.M.,
Dineshkumar
B.,
Narayana
C.R.,
Mango leaf extract synthesized silver nanorods exert anticancer activity on breast cancer and colorectal carcinoma cells. Journal of Drug Delivery Science and Technology.
2018;
44
:
8-12
.
View Article Google Scholar -
Jores
K.,
Mehnert
W.,
Drechsler
M.,
Bunjes
H.,
Johann
C.,
Mäder
K.,
Investigations on the structure of solid lipid nanoparticles (SLN) and oil-loaded solid lipid nanoparticles by photon correlation spectroscopy, field-flow fractionation and transmission electron microscopy. Journal of Controlled Release.
2004;
95
(2)
:
217-227
.
View Article PubMed Google Scholar -
Molpeceres
J.,
Aberturas
M.,
Guzman
M.,
Biodegradable nanoparticles as a delivery system for cyclosporine: preparation and characterization. Journal of microencapsulation.
2000;
17
(5)
:
599-614
.
View Article PubMed Google Scholar -
Borchert
H.,
Shevchenko
E.V.,
Robert
A.,
Mekis
I.,
Kornowski
A.,
Grübel
G.,
Weller
H.,
Determination of nanocrystal sizes: a comparison of TEM, SAXS, and XRD studies of highly monodisperse CoPt3 particles. Langmuir.
2005;
21
(5)
:
1931-1936
.
View Article PubMed Google Scholar -
Siddiqui
M. A.,
Kashyap
M. P.,
Kumar
V.,
Al-Khedhairy
A. A.,
Musarrat
J.,
Pant
A. B.,
Protective potential of trans-resveratrol against 4-hydroxynonenal induced damage in PC12 cells. Toxicology in Vitro.
2010;
24
(6)
:
1592-1598
.
View Article Google Scholar -
El-Naggar
N.E.A.,
Hussein
M.H.,
El-Sawah
A.A.,
Phycobiliprotein-mediated synthesis of biogenic silver nanoparticles, characterization, in vitro and in vivo assessment of anticancer activities. Scientific Reports.
2018;
8
(1)
:
8925
.
View Article PubMed Google Scholar -
Bialy
B.E.,
Hamouda
R.A.,
Khalifa
K.S.,
Hamza
H.A.,
Cytotoxic effect of biosynthesized silver nanoparticles on Ehrlich ascites tumor cells in mice. Int J Pharm.
2017;
13
(2)
:
134-144
.
View Article Google Scholar -
Pinzaru
I.,
Coricovac
D.,
Dehelean
C.,
Moaca
E.A.,
Mioc
M.,
Baderca
F.,
Sizemore
I.,
Brittle
S.,
Marti
D.,
Calina
C. D.,
Tsatsakis
A. M.,
Soica
C.,
Stable PEG-coated silver nanoparticles-a comprehensive toxicological profile. Food and Chemical Toxicology.
2018;
111
:
546-556
.
View Article PubMed Google Scholar -
Young
D.,
Effects of disease on Clinical Lab. Tests, 4th ed AACC.
2001
.
-
Larsen
K.,
Creatinine assay by a reaction-kinetic principle. Clinica chimica acta.
1972;
41
:
209-217
.
View Article Google Scholar -
Ellman
G.L.,
Tissue sulfhydryl groups. Archives of biochemistry and biophysics.
1959;
82
:
70-77
.
View Article Google Scholar -
Habig
W.H.,
Pabst
M.J.,
Jakoby
W.B.,
Glutathione S-transferases the first enzymatic step in mercapturic acid formation. Journal of biological Chemistry.
1974;
249
:
7130-7139
.
-
Rotruck
J.T.,
Pope
A.L.,
Selenium: biochemical role as a component of glutathione peroxidase. Science .
1973;
179
(4073)
:
588-590
.
View Article PubMed Google Scholar -
Aebi
H.,
Catalase in vitro. In Methods in enzymology. Elsevier.
1984;
:
121- 126
.
View Article Google Scholar -
W. Niehaus,
Samuelsson
B.,
Formation of malonaldehyde from phospholipid arachidonate during microsomal lipid peroxidation. European journal of biochemistry.
1968;
6
(1)
:
126-130
.
View Article PubMed Google Scholar -
Towbin
H.,
Staehelin
T.,
Gordon
J.,
Electrophoretic transfer of proteins from polyacrylamide gels to nitrocellulose sheets: procedure and some applications. Proceedings of the National Academy of Sciences.
1979;
76
(9)
:
4350 -4354
.
View Article PubMed Google Scholar -
Pozarowski
P.,
Darzynkiewicz
Z.,
Analysis of cell cycle by flow cytometry. in Checkpoint controls and cancer. Methods Mol Biol.
2004;
281
:
301-311
.
View Article PubMed Google Scholar -
Koopman
G.,
Reutelingsperger
C. P.,
Kuijten
G. A.,
Keehnen
R. M.,
Pals
S. T.,
Oers
M. H. Van,
Annexin V for flow cytometric detection of phosphatidylserine expression on B cells undergoing apoptosis. . Blood.
1994;
84
(5)
:
1415-1420
.
View Article PubMed Google Scholar -
Bancroft
J.D.,
Gamble
M.,
Theory and practice of histological techniques. Elsevier health sciences.
2008
.
-
Vigneshwaran
N.,
Ashtaputre
N. M.,
P. V. Varadarajan,
R. P. Nachane,
K. M. Paralikar,
R. H. Balasubramanya,
Biological synthesis of silver nanoparticles using the fungus Aspergillus flavus. Materials letters.
2007;
61
(6)
:
1413-1418
.
View Article Google Scholar -
Bose
D.,
Chatterjee
S.,
Biogenic synthesis of silver nanoparticles using guava (Psidium guajava) leaf extract and its antibacterial activity against Pseudomonas aeruginosa. Applied Nanoscience.
2016;
6
(6)
:
895-901
.
View Article Google Scholar -
Gomathi
A.C.,
Rajarathinam
S.R.,
A. Mohammed,
Rajeshkumar
S.,
Anticancer activity of silver nanoparticles synthesized using aqueous fruit shell extract of Tamarindus indica on MCF-7 human breast cancer cell line. Journal of Drug Delivery Science and Technology.
2020;
55
:
101376
.
View Article Google Scholar -
Antony
J.J.,
Sithika
M.A.A.,
Joseph
T.A.,
Suriyakalaa
U.,
In vivo antitumor activity of biosynthesized silver nanoparticles using Ficus religiosa as a nanofactory in DAL induced mice model. Colloids and Surfaces B: Biointerfaces.
2013;
108
:
185-190
.
View Article PubMed Google Scholar -
Mansour
H.H.,
Eid
M.,
El-Arnaouty
M.B.,
Effect of silver nanoparticles synthesized by gamma radiation on the cytotoxicity of doxorubicin in human cancer cell lines and experimental animals. Human & Experimental Toxicology.
2017;
37
(1)
:
38-50
.
View Article PubMed Google Scholar -
Guo
D.,
Zhu
L.,
Huang
Z.,
Zhou
H.,
Ge
Y.,
Ma
W.,
Wu
J.,
Zhang
X.,
Zhou
X.,
Zhang
Y.,
Zhao
Y.,
Gu
N.,
Anti-leukemia activity of PVP-coated silver nanoparticles via generation of reactive oxygen species and release of silver ions. Biomaterials.
2013;
34
(32)
:
7884-7894
.
View Article PubMed Google Scholar -
Al-Sheddi
E.S.,
Farshori
N.N.,
Al-Oqail
M. M.,
Al-Massanrani
S. M.,
Saquib
Q.,
Wahab
R.,
Musarrat
J.,
Al-Khedhairy
A. A.,
Siddiqui
M. A.,
Anticancer potential of green synthesized silver nanoparticles using extract of Nepeta deflersiana against human cervical cancer cells (HeLA). Bioinorganic Chemistry and Applications.
2018;
2018
:
9390784
.
View Article PubMed Google Scholar -
Li
L.,
Bi
Z.,
Sun
L.,
Song
Y.,
Chen
S.,
Mo
F.,
Yang
J.,
Wei
Y.,
Wei
X.,
Silver nanoparticles and silver ions cause inflammatory response through induction of cell necrosis and the release of mitochondria in vivo and in vitro. Cell Biology and Toxicology.
2020;
Online ahead of print
.
View Article Google Scholar -
Deng
W.,
Jiang
X.,
Mei
Y.,
Sun
J.,
Ma
R.,
Sun
H.,
Tian
H.,
Sun
X.,
Role of ornithine decarboxylase in breast cancer. Acta biochimica et biophysica Sinica.
2008;
40
(3)
:
235-243
.
View Article PubMed Google Scholar -
Soda
K.,
The mechanisms by which polyamines accelerate tumor spread. Journal of Experimental & Clinical Cancer Research.
2011;
30
(1)
:
95
.
View Article PubMed Google Scholar -
Geck
R.C.,
Foley
J.R.,
Stewart
T. M.,
Asara
J. M.,
Casero
R. A.,
Toker
A.,
Inhibition of the polyamine synthesis enzyme ornithine decarboxylase sensitizes triple-negative breast cancer cells to cytotoxic chemotherapy. Journal of Biological Chemistry.
2020;
295
(19)
:
6263-6277
.
View Article PubMed Google Scholar
Comments
Downloads
Article Details
Volume & Issue : Vol 7 No 11 (2020)
Page No.: 4100-4113
Published on: 2020-11-07
Citations
Copyrights & License
This work is licensed under a Creative Commons Attribution 4.0 International License.
Search Panel
Pubmed
Google Scholar
Pubmed
Google Scholar
Pubmed
Google Scholar
Pubmed
Google Scholar
Pubmed
Search for this article in:
Google Scholar
Researchgate
- HTML viewed - 7320 times
- Download PDF downloaded - 2068 times
- View Article downloaded - 0 times
