

Copyrights: Norhayati Mohd Zainee, Kalaivani Chellappan, Joseph Vehi, Petrick Periyasamy, Zuraidah Che Man, 2021. License: This work is licensed under a Creative Commons Attribution 4.0 International License.
Abstract
Introduction: The dynamic nature of dengue fever demands rapid and repeated clinical detection based on the vital signs variables, blood profile, and symptoms for providing timely clinical treatment. Patients with or without warning signs are at risk of contracting the severe dengue; thus, this study aims to identify the vital signs and blood profile variables that would differentiate the severity levels of dengue fever among dengue patients.
Methods: The patients were aged between 15 and 60 years and diagnosed with dengue infection. The infections were confirmed through laboratory tests positive either for the NS1 antigen or the dengue IgM antibody. The patients had no premorbid conditions.
Results: Our results show that dengue fever without warning signs and severe dengue can be differentiated using the pulse rate on day 3 (p = 0.008), day 4 (p = 0.004), day 5 (p = 0.005), and day 6 (p = 0.011) and the white blood cell count (p = 0.008) on day 7 of illness. Statistically significant parameters on day 6 of illness, such as systolic blood pressure (p = 0.001), pulse rate (p = 0.001), and hematocrit (p = 0.001), distinguished dengue fever with warning signs from the severe dengue category. Hematocrit (p = 0.000) was also found to be statistically significant in dengue fever with warning signs versus severe dengue on day 8 of illness. In conclusion, pulse rate was found to be a common marker for day 3 to day 6 even though other parameters were found to be significant. However, for day 7 and day 8, pulse rate was not found to be a contributor, instead, white blood cells and hematocrit were significant factors.
Conclusion: As the results of this study are based on a limited number of patients, it is recommended to further study the validity of the findings with a larger number of patients in the future.
Introduction
Dengue fever is an acute febrile illness caused by the dengue virus1, which is transmitted to humans from the bites of infected female Aedes aegypti mosquitoes2. Dengue fever is one of the top five notifiable infectious diseases in Malaysia3, 4. In 2015, 111,285 dengue cases, with 301 deaths, were reported to the World Health Organisation (WHO) by the Ministry of Health, Malaysia5. As of October 2018, 55,132 dengue cases, with 95 deaths, were reported on the Malaysia iDengue community portal6. The three dengue phases are febrile phase, critical phase, and the recovery phase7. During the febrile phase, in a person infected with dengue virus, an antibody is produced, which augments virus multiplication. The body temperature of someone infected with dengue increases to approximately 40oC due to increased blood dilatation, causing hyperemia and increasing local heat release and redness; one of the symptoms of dengue is red rashes1. At the same time, the blood pressure of an infected person can be low or considered hypotensive and also, the pulse rate (PR) decreases due to vasodilation. A critical phase in dengue occurs during the defervescence of body temperature. As the permeability of the capillaries increases, it induces plasma leakage, causing hematocrit concentrations to increase by 20% along with an increase in patient blood level8. Due to plasma leakage, blood clotting occurs at the site of capillary injury and leukocytes (white blood cells [WBC]) accumulate; however, leukocyte concentrations decrease because used in defense against the viral infection. Platelet concentrations also decrease because dengue suppresses the bone marrow, where platelets are produced9. The blood cells affected by the dengue virus become damaged, leading to a drastic reduction in number. The antibodies produced during dengue are associated with the massive destruction of platelets9. Monitoring plasma leakage, hemodynamic status, clinical signs of plasma leakage, and hematocrit before the severe form develops, comprise appropriate dengue management10. Dengue’s dynamic nature demands close monitoring, as well as rapid and repeated clinical detection to provide timely clinical treatment11, 12. Measurement of vital signs plays a fundamental role in many medical evaluations; however, there has been no large-scale study reporting daily vital signs in patients with dengue13. In dengue, vital signs such as blood pressure, PR, and body temperature play important roles in the control and diagnosis of dengue14. Hence, an analysis of the vital signs and blood profile of patients with dengue in relation to dengue severity was performed in this study.
Methods
Data collection and patient selection
This study’s clinical data were obtained from a database of patients who were presented to the Hospital Canselor Tuanku Muhriz (HCTM) Emergency Department between January 2015 and January 2016, and were suspected of having dengue fever and admitted to the wards for monitoring. Patients who fulfilled the following criteria were selected: Malaysian citizens aged between 15 and 60-years; confirmed as having acute dengue infection through laboratory tests, positive either for the NS1 antigen or the dengue IgM antibody; and no premorbid conditions such as diabetes, pregnancy, renal failure, or HIV. The patients’ information was screened using the emergency department observation ward logbook and relevant information was retrieved from medical records. Vital sign variables were extracted from the patients’ triage registration form at the emergency department, from the patients’ dengue charts, and from the blood profile data available on the HCTM online database. The Research Ethics Committee of HCTM approved the study (UKM1.5.3.5 /244/FKAB-2015-03).
Data preparation and presentation
The clinical presentation was classified according to the latest WHO guidelines and the Malaysian Clinical Practice Guidelines for dengue13, 15. Dengue is clinically classified as dengue fever without warning signs (DF), dengue fever with warning signs (DFWS), and severe dengue (SD) by the WHO1, 13, 15. The data were clustered based on dengue categories, vital sign variables (body temperature, systolic blood pressure [SBP], diastolic blood pressure [DBP], pulse pressure, and pulse rate [PR]), and blood profile variables (hematocrit, platelet, and WBCs). These data were then calculated into the median or mean parameter, based on the spread of the data16. As such, PR, pulse pressure, DBP, SBP, and platelets were analyzed using the median value while body temperature, hematocrit, and WBC were analyzed using the mean value.
Statistical analysis
The statistical analysis was conducted using IBM SPSS version 21. The distribution of the data from day 3 to day 8 of illness was assessed using Shapiro-Wilk, Skewness and Kurtosis, and homogeneity tests for the continuous variables. From this analysis, the PR and hematocrit data were normally distributed on days 6 and day 8 of illness. These normally distributed data were further analyzed using an analysis of variance (ANOVA), and the differences between groups were evaluated by using an Independent Sample T-test. For the non-normally distributed data, the variable was evaluated by using a Kruskal–Wallis analysis with post hoc significance testing (Bonferroni–Dunn).
| DF (n = 6) | DFWS (n = 43) | SD (n = 13) | |
| Sex, no. (%) | |||
| Male | 5 (83) | 28 (64) | 4 (31) |
| Female | 1 (17) | 15 (36) | 9 (69) |
| Ethnicity, no. (%) | |||
| Malay | 3 (50) | 29 (66) | 7 (54) |
| Chinese | 2 (33) | 14 (34) | 4 (31) |
| Indian | 1 (17) | 0 | 2 (15) |
| Serology, no. (%) | |||
| NS1 (+) | 0 | 13 (30) | 5 (38) |
| IgM (+) | 4 (67) | 11 (25) | 3 (23) |
| IgM (+) + IgG (+) | 2 (33) | 16 (39) | 4 (31) |
| NS1 (+) + IgG (+) | 0 | 3 (7) | 1 (8) |
| Fatalities, no. (%) | 0 | 0 | 2 (15) |
| Mean day of admission | 4 | 5 | 6 |
| DF (n = 6) | DFWS (n = 43) | SD (n = 13) | p-value | |
|---|---|---|---|---|
| Day 3 | ||||
| Body temperature (°C) | 37.4 (37.1 - 37.6) | 37.4 (37.2 - 37.9) | 37.2 (36.9 - 37.4) | 0.285 |
| Systolic blood pressure (mmHg) | 114 (106 - 116) | 119 (107 - 125) | 107 (106 - 118) | 0.154 |
| Diastolic blood pressure (mmHg) | 60 (57 - 63) | 68 (61 - 75) | 64 (57 - 72) | 0.088 |
| Pulse pressure (mmHg) | 49 (47 - 54) | 50 (46 - 54) | 47 (40 - 55) | 0.528 |
| Pulse rate (bpm) | 71 (68 - 74) | 79 (71 - 87) | 97 (78 - 112) | 0.006* |
| Hematocrit (%) | 43.4 (42 - 47.4) | 45.5 (41.7 - 47.8) | 39.3 (31.7 - 46.8) | 0.118 |
| Platelets (x10 3 µL) | 30 (24 - 40) | 53 (30 - 90) | 31 (24 - 72) | 0.102 |
| White blood cells (x10 3 µL) | 3.0 (2.6 - 3.3) | 3.9 (2.7 - 5.0) | 5.3 (4.1 - 8.5) | 0.440 |
| Day 4 | ||||
| Body temperature (°C) | 37.3 (37 - 37.5) | 37.8 (37.2 - 38.3) | 37.3 (36.6 - 37.8) | 0.117 |
| Systolic blood pressure (mmHg) | 112 (106 - 115) | 122 (110 - 129) | 109 (103 - 119) | 0.011 |
| Diastolic blood pressure (mmHg) | 59 (57 - 63) | 69 (65 - 76) | 61 (60 - 68) | 0.006* |
| Pulse pressure (mmHg) | 49 (47 - 51) | 51 (45 - 56) | 47 (41 - 49) | 0.209 |
| Pulse rate (bpm) | 71 (68 - 74) | 84 (73 - 88) | 91 (81 - 106) | 0.006* |
| Hematocrit (%) | 43.9 (42 - 47.7) | 45.5 (42.1 - 48.9) | 42.9 (34.8 - 46.0) | 0.127 |
| Platelets (x10 3 µL) | 30 (23 - 40) | 63 (32 - 112) | 34 (20 - 95) | 0.061 |
| White blood cells (x10 3 µL) | 3.1 (2.7 - 3.3) | 3.3 (2.4 - 4.5) | 4.8 (2.2 - 9.9) | 0.459 |
| Day 5 | ||||
| Body temperature (°C) | 37.2 (37.0 - 37.5) | 37.9 (37.1 - 38.4) | 37.0 (36.8 - 37.6) | 0.030 |
| Systolic blood pressure (mmHg) | 110 (107 - 113) | 117 (111 - 125) | 107 (101 - 119) | 0.026 |
| Diastolic blood pressure (mmHg) | 57 (56 - 62) | 70 (64 - 76) | 60 (58 - 72) | 0.016 |
| Pulse pressure (mmHg) | 47 (46 - 50) | 50 (43 - 55) | 48 (36 - 53) | 0.590 |
| Pulse rate (bpm) | 72 (70 - 73) | 80 (72 - 89) | 93 (80 - 105) | 0.006* |
| Hematocrit (%) | 44.7 (42.1 - 47.7) | 46.1 (42.6 - 48.9) | 38.3 (37.1 - 45.2) | 0.049 |
| Platelets (x10 3 µL) | 31 (23 - 42) | 51 (22 - 105) | 34 (20 - 69) | 0.335 |
| White blood cells (x10 3 µL) | 2.9 (2.5 - 4.0) | 3.4 (2.3 - 4.3) | 4.1 (2.3 - 8.4) | 0.421 |
| Day 6 | ||||
| Body temperature (°C) | 37.3 (37.1 - 37.8) | 37.3 (36.9 - 37.7) | 37.2 (36.8 - 37.6) | 0.676 |
| Systolic blood pressure (mmHg) | 109 (105 - 114) | 119 (107 - 123) | 100 (95 - 107) | 0.002* |
| Diastolic blood pressure (mmHg) | 60 (57 - 63) | 68 (60 - 74) | 60 (54 - 70) | 0.031 |
| Pulse pressure (mmHg) | 49 (47 - 51) | 50 (45 - 55) | 45 (39 - 47) | 0.039 |
| Pulse rate (bpm) | 71 (68 - 78) | 78 (72 - 88) | 89 (82 - 103) | 0.001* |
| Hematocrit (%) | 43.5 (41.8 - 47.7) | 45.9 (41.7 - 48.3) | 40.4 (35.1 - 44.1) | 0.004* |
| Platelets (x10 3 µL) | 33 (25 - 42) | 45 (18 - 79) | 38 (17 - 64) | 0.747 |
| White blood cells (x10 3 µL) | 3.1 (2.2 - 4.6) | 3.6 (2.7 - 5.5) | 6.1 (4.5 - 9.9) | 0.014 |
| Day 7 | ||||
| Body temperature (°C) | 37.1 (37 - 37.6) | 37.1 (37.0 - 37.3) | 37.0 (37.0 - 37.4) | 0.871 |
| Systolic blood pressure (mmHg) | 109 (104 - 117) | 113 (106 - 123) | 105 (99 - 114) | 0.236 |
| Diastolic blood pressure (mmHg) | 60 (54 - 62) | 64 (59 - 71) | 60 (59 - 70) | 0.349 |
| Pulse pressure (mmHg) | 49 (46 - 52) | 50 (44 - 45) | 44 (39 - 52) | 0.217 |
| Pulse rate (bpm) | 73 (61 - 76) | 76 (70 - 80) | 81 (77 - 98) | 0.012 |
| Hematocrit (%) | 44.4 (42.5 - 47.2) | 45.3 (40.0 - 47.4) | 38.2 (29.8 - 42.4) | 0.013 |
| Platelets (x10 3 µL) | 33 (27 - 50) | 50 (24 - 82) | 47 (27 - 76) | 0.642 |
| White blood cells (x10 3 µL) | 3.6 (2.4 - 4.5) | 4.3 (3.3 - 6.6) | 7.7 (6.0 - 9.8) | 0.004* |
| Day 8 | ||||
| Body temperature (°C) | 37.1 (37.0 - 37.1) | 37.1 (36.9 - 37.4) | 36.9 (36.8 - 37.0) | 0.274 |
| Systolic blood pressure (mmHg) | 112 (106 - 113) | 117 (107 - 124) | 106 (99 - 118) | 0.191 |
| Diastolic blood pressure (mmHg) | 60 (58 - 62) | 66 (58 - 71) | 63 (56 - 72) | 0.262 |
| Pulse pressure (mmHg) | 49 (48 - 53) | 51 (46 - 55) | 45 (37 - 51) | 0.272 |
| Pulse rate (bpm) | 69 (68 - 71) | 72 (66 - 81) | 78 (72 - 97) | 0.040 |
| Hematocrit (%) | 44.7 (41.6 - 47.9) | 44.1 (40.3 - 47.0) | 35.5 (31.4 - 42.4) | 0.000* |
| Platelets (x10 3 µL) | 39 (30 -47) | 63 (42 -105) | 74 (59 - 91) | 0.179 |
| White blood cells (x10 3 µL) | 3.7 (3.2 - 5.2) | 4.9 (3.7 - 6.4) | 6.9 (4.9 - 9.9) | 0.080 |
| Dengue category | DF VS DFWS | DF VS SD | DFWS VS SD |
| Day of illness | |||
| Day 3 | |||
| Pulse rate | p = 0.308 | p = 0.008* | p = 0.045 |
| Day 4 | |||
| Diastolic | p = 0.020 | p = 0.921 | p = 0.98 |
| Pulse rate | p = 0.074 | p = 0.004* | p = 0.187 |
| Day 5 | |||
| Pulse rate | p = 0.118 | p = 0.005* | p = 0.119 |
| Day 6 | |||
| Systolic | p = 0.748 | p = 0.616 | p = 0.001* |
| Pulse rate | p = 0.147 | p = 0.011* | p = 0.001* |
| Hematocrit | p = 0.872 | p = 0.092 | p = 0.001* |
| Day 7 | |||
| White blood cells | p = 0.422 | p = 0.008* | p = 0.022 |
| Day 8 | |||
| Hematocrit | p = 0.750 | p = 0.028 | p = 0.000* |


Results
In this study, 62 patients who were presented to the emergency department were selected. These selected patients represented the spectrum of dengue illness and fulfilled the screening criteria. Sample characteristics and laboratory results according to the various classifications are summarized in Table 1. To obtain a sensitive result, a significant difference of p < 0.01 was used in the analysis. Table 2 shows the analysis result of the Kruskal–Wallis and one-way ANOVA.
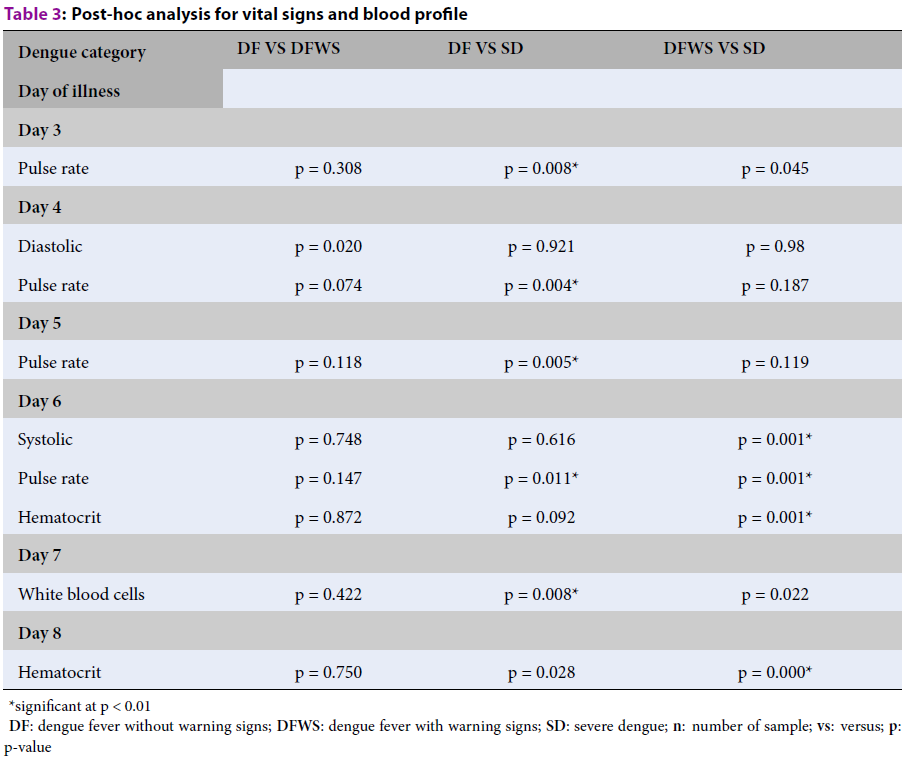
The result shows five variables (PR, SBP, DBP, WBC, and hematocrit) were statistically significant in all dengue categories from day 3 to day 8 of illness. The analysis for PR detailed on day 3 is (χ2 (2) = 10.222; p = 0.006); on day 4, the DBP was (χ2(2) = 10.239; p = 0.006) and the PR (χ2(2) = 10.213; p = 0.006). On day 5, the PR (χ2(2) = 10.192; p = 0.006); and on day 6, the SBP was (χ2(2) = 13.002; p = 0.002). The significant difference in PR and hematocrit on day 6 were determined using a one-way ANOVA, the PR (F(2,59) = 8.252; p = 0.001), and hematocrit (F (2,59) = 6.161; p = 0.004). On day 7, the WBC count was (χ2 (2) = 10.967; p = 0.004) and on day 8, the hematocrit (F (2, 59) = 8.964; p = 0.000). All these significant differences in dengue categories were further analyzed to identify the significant difference in DF vs. DFWS, DF vs. SD, and DFWS vs. SD. The results are shown in Table 3.
The analysis in this study shows that DF and SD can be differentiated using PR from day 3 to day 6 of illness and WBCs for the blood profile on day 7. For DFWS and SD, two vital signs variables and one blood profile variable can be used to differentiate these categories for days 6 and 8 of illness. On day 6, SBP, PR, and hematocrit were statistically significant variables in DFWS vs. SD category, whereas on day 8, only hematocrit showed a significant difference. A box-plot presentation of this evolution is shown in Figure 1 and Figure 2. The horizontal bar is the median value, and the shaded box is the 25%–75% interquartile range. The box plots in Figure 1 describe changes in PR from day 3 to day 6 and WBCs on day 7 for DF vs. SD. The box plots in Figure 2 describe changes in PR, SBP, and hematocrit for DFWS vs. SD category for days 6 and 8 of illness.
Discussion
Vital signs monitoring in dengue fever empowers dengue progression diagnosis, and appropriate monitoring ensures more effective dengue management17. Accuracy of dengue progression monitoring depends on the protocol practiced in the hospital, the sensitivity of the devices, and the timely actions18. Patients with or without warning signs are at risk for severe dengue, physiological parameter monitoring has been recommended as the reference. This study has identified pulse rate as a statistically significant variable from day 3 to day 6 to differentiate the dengue fever severity level1, 19.
We conducted a retrospective study on the data of the patients admitted with dengue fever at the Emergency Department of HCTM. In this study, dengue fever severity was distinguished based on DF, DFWS, and SD. The severity of DF could only be distinguished starting from day 3 when most patients start to move into the critical phase or severe dengue20. In our study, PR and WBC were statistically significant parameters in DF vs SD category. A previous study in Singapore that referenced the WHO Dengue Classification 1997 protocol, had found that PR in patients with DF was lower than those of patients with dengue hemorrhagic fever, which is similar to the findings of this study21. The increased PR in SD compared with DF is due to peripheral vasoconstriction that caused blood vessel narrowing as an outcome of the vessel muscular wall contraction1, 22, 23. In another study conducted in Singapore recorded WBC count known as leukopenia, from day 3 to day 7 of the illness; this is reassured by studies in India and Sri Lanka that referenced to WHO Dengue Classification 199724, 25, 26. The WBC count usually starts to increase either in the recovery phase or due to the stress response in patients with severe bleeding1. The recovery phase had occurred 24–48 hours after the critical phase1; in this case, the recovery phase was predicted to start on day 6 of the illness, which supported our findings when the WBC was found to be statistically significant in DF vs SD on day 7.
SBP, PR, and hematocrit were the variables that reached statistical significance in DFWS and SD on day 6 (p = 0.001) and hematocrit (p = 0.000) on day 8 of the illness. Given that the clinical presentation of DFWS and SD are the same, physicians frequently focus on SBP and ignore the increasing DBP and PR when monitoring for SD. This indicates the pitfall in dengue management and highlights the importance of SBP together with PR monitoring in differentiating the DFWS from SD1. The study in Malaysia that divided the severe dengue cases based on WHO Dengue Classification 2009 into severe dengue (survived) and severe dengue (died) found that PR was statistically significant, which is similar to this study27. A previous study in Indonesia had found hematocrit was statistically significantly different in Dengue Grade I, II, and III (WHO Dengue Classification 2011) while a study in Thailand, found hematocrit was statistically significantly on day 6 of the illness using dengue with and without shock classifications18, 28. In our finding, however, hematocrit was statistically significant on days 6 and 8 based on the WHO Dengue Classification 2009. A critical phase in DFWS was predicted to occur starting on day 5 of illness, whereas SD critical phase could be predicted on day 4 by referring to body temperature, platelets, and hematocrit trends in Table 2. Due to this condition, hematocrit was statistically significant on days 6 and 8 in the SD category, entering the recovery phase from day 6 onwards.
A limitation of this study is that no special reference letters were received from the general practitioners’ clinics to identify the actual day the patients started having fever. Besides that, individual patients progressed differently through the phases of the illness depending on their immune system’s response to the virus and to treatment interventions. In this discussion, we have identified PR as a significant parameter to be monitored from day 3 to day 6; WBC for day 7; and PR, SBP, and hematocrit for days 6 and 8. However, the small sample size, lack of actual fever commencement details, and individual physiology trends encourage further studies on the validity of the findings with a larger number of patients.
Conclusions
In conclusion, PR and WBCs were the variables that could be used to differentiate DF and SD severity from day 3 to day 7 of the illness, whereas PR, SBP, and hematocrit could be used to differentiate DFWS and SD severity on days 6 and 8 of illness. Continuous vital sign and blood profile monitoring could assist physicians in identifying the dengue severity category and provide appropriate treatment, which could reduce the complexity of dengue management. Yet the study recommends a multi-center study with a larger sample size in each category as per WHO Dengue Classification 2009.
Abbreviations
BT: Body temperature
DBP: Diastolic blood pressure
DF: Dengue fever without warning signs
DFWS: Dengue fever with warning signs
HCT: Hematocrit
PLT: Platelet
PP: Pulse pressure
PR: Pulse rate
SBP: Systolic blood pressure
SD: Severe dengue
WBC: White blood cell
Acknowledgments
The authors would like to acknowledge the HCTM CREM and emergency department staff for their assistance and advice during the data collection.
Author’s contributions
Norhayati Mohd Zainee as main author, responsible for the content of this journal,analysis (graph and statistics) and data collection. Kalaivani Chellappan as corresponding author and supervisor, responsible in the journal study design and clinical ethics. Joseph Vehi is co-supervisor responsible for the study design. Petrick and Zuraidah responsible for clinical journal study design and data collection at HCTM. All authors read and approved the final manuscript.
Funding
Fundamental Research Grant Scheme (FRGS)
Availability of data and materials
Data and materials used and/or analyzed during the current study are available from the corresponding author on reasonable request.
Ethics approval and consent to participate
This retrospective study has been approved by the Research Committee of HCTM. Ethics certificate number (UKM 1.5.3.5/244/FKAB--2015-03).
Consent for publication
Not applicable.
Competing interests
The authors declare that they have no competing interests.
References
-
World Health Organization. Handbook For Clinical Management Of Dengue. Geneva: WHO. 2012: 114..
.
-
Bhatt
S.,
Gething
P.W.,
Brady
O.J.,
Messina
J.P.,
Farlow
A.W.,
Moyes
C.L.,
The global distribution and burden of dengue. Nature.
2013;
496
(7446)
:
504-7
.
View Article PubMed Google Scholar -
World Health Organization. Malaysia:Country Cooperation Stretegy at Glance. 2013.
.
-
Daumas
R.P.,
Passos
S.R.,
Oliveira
R.V.,
Nogueira
R.M.,
Georg
I.,
Marzochi
K.B.,
Clinical and laboratory features that discriminate dengue from other febrile illnesses: a diagnostic accuracy study in Rio de Janeiro, Brazil. BMC Infect Dis.
2013;
13
(1)
:
77
.
View Article PubMed Google Scholar -
World Health Organization. Dengue Situation Update 482 Update on the Dengue situation in the Western Pacific Region. 2015;2014(482):5.
.
-
Agensi Remote Sensing Malaysia (ARSM), Kementerian Sains Teknologi dan Inovasi (MOSTI) KKM (KKM). iDengue untuk Komuniti [Internet]. Available from: http://idengue.remotesensing.gov.my/.
.
-
Woon
Y.L.,
Hor
C.P.,
Hussin
N.,
Zakaria
A.,
Goh
P.P.,
Cheah
W.K.,
A Two-Year Review on Epidemiology and Clinical Characteristics of Dengue Deaths in Malaysia, 2013-2014. PLoS Negl Trop Dis.
2016;
10
(5)
:
e0004575
.
View Article PubMed Google Scholar -
Management of Dengue Infection in Adults (3rd Edition) 2015 available on-line at: http://www.acadmed.org.my/index.cfm?&menuid=67.
.
-
Srichaikul
T.,
Nimmannitya
S.,
Haematology in dengue and dengue haemorrhagic fever. Best Pract Res Clin Haematol.
2000;
13
(2)
:
261-76
.
View Article PubMed Google Scholar -
Dengue clinical management 2013. Facilitator's training manual, WHO Western Pacific Region.
.
-
Srikiatkhachorn
A.,
Rothman
A.L.,
Gibbons
R.V.,
Sittisombut
N.,
Malasit
P.,
Ennis
F.A.,
Dengue - best to classify it. Clin Infect Dis.
2011;
53
(6)
:
563-7
.
View Article PubMed Google Scholar -
Shu
P.Y.,
Huang
J.H.,
Current advances in dengue diagnosis. Clin Diagn Lab Immunol.
2004;
11
(4)
:
642-50
.
View Article PubMed Google Scholar -
Ng
E.L.,
Thein
T.L.,
Hao
Y.,
Lee
L.,
Lye
D.,
Leo
Y.S.,
Vital signs in elderly dengue patients: trends of blood pressure and pulse rate. Int J Infect Dis.
2014;
21
( S1)
:
447
.
View Article Google Scholar -
Kalayanarooj
S.,
Clinical Manifestations and Management of Dengue/DHF/DSS. Trop Med Health.
2011;
39
(4)
:
83-7
.
View Article PubMed Google Scholar -
Chawla
P.,
Yadav
A.,
Chawla
V.,
Clinical implications and treatment of dengue. Asian Pac J Trop Med.
2014;
7
(3)
:
169-78
.
View Article PubMed Google Scholar -
McCluskey
A.,
Lalkhen
A.G.,
Statistics
I.I.,
Central tendency and spread of data. Contin Educ Anaesth Crit Care Pain.
2007;
7
(4)
:
127-30
.
View Article Google Scholar -
Pinsky
M. R.,
Functional hemodynamic monitoring. Crit Care Clin.
2015;
31
(1)
:
89-111
.
View Article PubMed Google Scholar -
Thanachartwet
V.,
Wattanathum
A.,
Sahassananda
D.,
Wacharasint
P.,
Chamnanchanunt
S.,
Kyaw
E. Khine,
Dynamic Measurement of Hemodynamic Parameters and Cardiac Preload in Adults with Dengue: A Prospective Observational Study. PLoS One.
2016;
11
(5)
:
e0156135
.
View Article PubMed Google Scholar -
Hadinegoro
S.R.,
The revised WHO dengue case classification: does the system need to be modified?. Paediatr Int Child Health.
2012;
32
(1)
:
33-8
.
View Article PubMed Google Scholar -
Ralapanawa
U.,
Alawattegama
A.T.,
Gunrathne
M.,
Tennakoon
S.,
Kularatne
S.A.,
Jayalath
T.,
Value of peripheral blood count for dengue severity prediction. BMC Res Notes.
2018;
11
(1)
:
400
.
View Article PubMed Google Scholar -
Lee
V.J.,
Lye
D.C.,
Sun
Y.,
Fernandez
G.,
Ong
A.,
Leo
Y.S.,
Predictive value of simple clinical and laboratory variables for dengue hemorrhagic fever in adults. J Clin Virol.
2008;
42
(1)
:
34-9
.
View Article PubMed Google Scholar -
World Health Organization. Dengue: guidelines for diagnosis, treatment, prevention, and control [Internet]. New Editio. Special Programme for Research and Training in Tropical Diseases. 2009. x, 147. Available from: http://whqlibdoc.who.int/publications/2009/9789241547871_eng.pdf. 2009
.
-
Saldaña-Herrera
V.G.,
Legorreta-Soberanis
J.,
Andersson
N.,
Ramírez-Hernández
E.,
Castillo-Medina
J.A. del,
Salas-Franco
L.S.,
Clinical profile of dengue and predictive severity variables among children at a secondary care hospital of Chilpancingo, Guerrero, Mexico: case series. Bol Med Hosp Infant Mex.
2016;
73
(4)
:
237-242
.
PubMed Google Scholar -
Kularatne
S.A.,
Gawarammana
I.B.,
Kumarasiri
P.R.,
Epidemiology, clinical features, laboratory investigations and early diagnosis of dengue fever in adults: a descriptive study in Sri Lanka. Southeast Asian J Trop Med Public Health.
2005;
36
(3)
:
686-92
.
PubMed Google Scholar -
Narasimhan
D.,
Katragadda
S.,
Sathish
M.,
Retrospective study of white blood cell count and hematocrit in dengue fever. Int J Adv Med.
2018;
5
(1)
:
24-26
.
View Article Google Scholar -
Lee
V.J.,
Lye
D.C.,
Sun
Y.,
Leo
Y.S.,
Decision tree algorithm in deciding hospitalization for adult patients with dengue haemorrhagic fever in Singapore. Trop Med Int Health.
2009;
14
(9)
:
1154-9
.
View Article PubMed Google Scholar -
Md-sani
S.S.,
Md-noor
J.,
Han
W.,
Gan
S.,
Rani
N.,
Tan
H.,
Prediction of mortality in severe dengue cases. BMC Infect Dis.
2018;
18
(1)
:
232
.
View Article PubMed Google Scholar -
Triana
D.,
Kurniati
A.,
Wirastari
G.G.,
Relationship Between Platelet, Hematocrit and Leukocyte with Dengue Severity in Bengkulu City, Indonesia. Eur J Mol and Clinical Med.
2020;
7
(10)
:
2305-11
.
Comments
Downloads
Article Details
Volume & Issue : Vol 8 No 7 (2021)
Page No.: 4447-4455
Published on: 2021-07-30
Citations
Copyrights & License
This work is licensed under a Creative Commons Attribution 4.0 International License.
Search Panel
Pubmed
Google Scholar
Pubmed
Google Scholar
Pubmed
Google Scholar
Pubmed
Google Scholar
Pubmed
Search for this article in:
Google Scholar
Researchgate
- HTML viewed - 8360 times
- Download downloaded - 1509 times
- View Article downloaded - 0 times
