

Copyrights: Fathi Zakareia El Sewy, Magdy Helmi Megalaa, Neveen Lewis Michael, Nader Fayek Tadros, 2022. License: This work is licensed under a Creative Commons Attribution 4.0 International License.
Abstract
Background: The incidence of type 2 diabetes mellitus (T2DM) has been increasing in recent years. As such, early identification and management of its complications—especially diabetic foot disease (DFD)—is of great importance. Multiple factors are involved in the pathogenesis of DFD; in this study, we aimed to study the association between plasminogen activator inhibitor-1 (PAI-1), high-sensitivity C-reactive protein (hs-CRP), 1st hour erythrocyte sedimentation rate (ESR), and DFD.
Methods: The present work was conducted on 200 T2DM patients with DFD (group I), 200 T2DM patients without DFD (group II), and 100 healthy subjects (group III, as a control group). Serum PAI-1 levels (using ELISA) and other inflammatory markers (hs-CRP and 1st hour ESR) were measured in the three groups.
Results: T2DM patients with DFD had significantly higher mean serum levels of inflammatory markers (including PAI-1, hs-CRP, and 1st hour ESR) compared to T2DM patients without DFD and the control group (p < 0.001). There was a significant positive correlation between inflammatory markers (including PAI-1, hs-CRP, and 1st hour ESR), metabolic control parameters (including fasting plasma glucose, 2-hour postprandial plasma glucose, and glycated hemoglobin), and severity of DFD in group I and group II (p < 0.001).
Conclusion: DFD is associated with elevated indicators of systemic and vascular inflammation. PAI-1, hs-CRP, and 1st hour ESR can be considered as early predictors for vascular tissue damage and can be used for early detection of complications in diabetic patients. Among these indicators, hs-CRP has greater diagnostic value in the detection of DFD.
Introduction
Diabetes mellitus (DM) is a metabolic disease characterized by hyperglycemia which results from defects in insulin secretion, insulin action, or both. Type 2 DM (T2DM) is caused by insulin resistance and usually relative rather than absolute insulin deficiency1. Vasculature is greatly affected by DM, leading to both microvascular (e.g., diabetic kidney disease, retinopathy, and neuropathy) and macrovascular (e.g., myocardial infarction, stroke, and peripheral arterial disease) complications2. Furthermore, diabetic patients are more susceptible to accelerated atherosclerosis, which results in macrovascular complications and premature death3.
About 12 — 25% of diabetic patients will develop DFD at some stage during their lives4, representing the most common cause of non-traumatic limb loss in developed countries5. In fact, the risk of amputation in diabetic patients is about 30 – 40 times higher than in patients without diabetes according to several statistical findings6. Foot deformities, limited joint mobility, previous ulceration or amputation, impaired visual acuity, older age, chronic kidney disease, long duration of diabetes, and sustained uncontrolled hyperglycemia are considered to be risk factors for developing DFD7.
Plasminogen activator inhibitor-1 (PAI-1) is a single chain glycoprotein member of the superfamily of serine-protease inhibitors8. The increased expression of PAI-1 in vivo suppresses fibrinolysis, which leads to deposition of fibrin and tissue damage9. Moreover, PAI-1 directly interacts with vascular cells and plays a role in angiogenesis and the regulation of cell replication, as well as many other biological functions10, 11, 12, 13.
It is well established that the risk of coronary heart disease (CHD) is closely associated with circulating PAI-1 levels and activity11. Also, PAI-1 levels are higher in patients with hyperinsulinemia12 and T2DM13, possibly related to the oxidation of serum low-density lipoprotein (LDL)14 and insulin resistance15. Accordingly, in the present study, we aimed to determine whether there is any association between PAI-1, other inflammatory markers, metabolic control parameters, and DFD.
Methods
This case-control study was conducted on 500 subjects aged 30 – 70 years, who were divided into three groups: group I (200 T2DM patients with DFD), group II (200 T2DM without DFD), and group III (100 healthy, age and sex matched control subjects). DFD was defined as having one or more of the following: diabetic peripheral neuropathy (loss of monofilament, vibration sense), peripheral arterial disease (absent foot pulsation, ankle brachial index (ABI) of 0.9), and/or non-infected diabetic foot ulcers. Then, each case of DFD was classified according to level of severity: mild, moderate, and severe. Mild DFD included cases with diabetic neuropathy, moderate DFD included cases with peripheral neuropathy and peripheral arterial disease, and severe DFD included cases with foot ulcers with or without amputation.
Exclusion criteria were as follows: patients with a history of decompensated liver disease (ALT ≥ 3 upper limit of normal), renal impairment (eGFR ≤ 30 ml/m), congestive heart failure, chronic inflammatory conditions (including rheumatoid arthritis, systemic lupus erythematosus, and inflammatory bowel disease), and active diabetic foot infection. All the participants included in the study were informed about the nature of the study, and their oral and written consent for voluntary participation in the study were obtained. Approval from the Ethics Committee of the Alexandria University, Faculty of Medicine was also obtained.
Full medical histories were recorded for all of the subjects in our study (duration of DM; medication history; smoking history; and comorbid diseases, e.g., hypertension, CHD, cerebrovascular stroke, claudication, revascularization, and laser photocoagulation). Complete physical examinations were performed and anthropometric measurements—body mass index (BMI)16 and waist circumference (WC)17 —were calculated. Comprehensive foot examinations included inspection for foot ulcers and/or amputations, as well as foot abnormalities such as hallux valgus, hammer/claw toe, flat foot, Charcot foot, callus, corns, fissuring, and toe web macerations. In addition, the nails were inspected for nail dystrophies, ingrown nails, and onchomychosis18.
The 10 g Semmes–Weinstein monofilament evaluation was used to determine the neurological condition of the foot. Initially, the patient experienced a sense of pressure from the buckling of the 10 g monofilament on a proximal spot. The monofilament was then placed on the plantar surface of the foot perpendicular to the skin, raising the pressure until the filament buckled, with the patients unable to see their feet. When the patients felt something, they were asked to reply “yes”. Callus-prone areas were avoided. When a patient feels fewer than seven sites on their foot, it is categorized as sensory neuropathy or loss of protective sensibility. If the patient feels seven or more locations on their foot, it is considered typical19.
The ABI for the dorsalis pedis and posterior tibial arteries of both feet were measured to determine the peripheral vascular condition of the foot. First, the pressures on the ankles were measured. Then, the greater of the two systolic pressures (from the posterior tibial and dorsalis pedis) at the ankle was compared to the higher reading of the right and left brachial artery pressures to determine the ABI. An ABI of 0.9 in at least one leg was used to define PAD. Standardized Doppler ultrasonic equipment was used to perform a hand-held Doppler for all patients (5 MHz; Nicolet Elite 200 R, VIASYS Healthcare Inc., Madison, WI, USA). The arterial waveforms of the patients were recorded and categorized as triphasic, biphasic, or monophasic20, 21.
Laboratory Investigations
Blood sampling: sampling was done for fasting plasma glucose (FPG) in the morning (8.00 – 10.00 AM, after 8 hours of overnight fasting); 2-hour postprandial plasma glucose (2h PPPG), glycated hemoglobin (HbA1c)22 ; complete blood count (CBC); serum aspartate transaminase (AST) and alanine transaminase (ALT); serum creatinine; fasting lipid profile (after 12 – 14 hours of overnight fasting), including serum total cholesterol (TC) and triglycerides (TG), serum high-density lipoprotein cholesterol (HDL-C), and serum low-density lipoprotein cholesterol (LDL-C); PAI-1 (using ELISA)23; high-sensitivity C-reactive protein (hs-CRP); and 1st hour erythrocyte sedimentation rate (ESR). The estimated glomerular filtration rate (eGFR) was calculated using the MDRD formula for staging of kidney disease. Early morning urine samples were obtained to assess urine albumin-to-creatinine ratio (UACR). Dilated fundus examination was performed for assessment and staging of the presence of diabetic retinopathy24.
Statistical Analysis
Data were input into the computer and analyzed using IBM SPSS software package version 20.0 (IBM Corp, Armonk, NY, USA). The Kolmogorov–Smirnov test was used to verify the normality of distribution. Statistical significance of the obtained results was set at the 5% level. Correlations between quantitative continuous variables and parameters were evaluated by multivariate regression analysis.
Results
General Characteristics
There was no statistically significant difference between the three groups regarding gender distribution (p = 0.067) or age (p = 0.166). Smokers constituted 97% of group I patients, compared to 63% for group II (p = 0.001). Patients with T2DM with DFD had longer duration of diabetes (p < 0.001). Regarding DFD, 29.5% of cases were mild, 32.0% were moderate, and 38.5% were severe. Foot ulcers were found in 39.5% of patients, and below knee amputations in 4%. Foot deformities were more prevalent in group I, where 9.5% had hammer/claw toe and 5.5% had Charcot foot. Diabetic retinopathy was more prevalent in group I, where 58% had NPR and 15.5% had PR. In T2DM patients with DFD, 48.5% were smokers (p = 0.001), 81.5% were hypertensive (p < 0.001), 17.5% had CHD (p = 0.001), 70% had claudication (p < 0.001), and 14.5% had a history of laser photocoagulation (p < 0.001). Patients with T2DM had higher BMI and WC values compared to the control group (p < 0.001 and p < 0.001, respectively). Systolic and diastolic blood pressure levels were also higher in patients with T2DM compared to the control group (p < 0.001, p < 0.001, and p < 0.001, respectively). No significant differences were observed when comparing patients with T2DM and DFD to those with T2DM without DFD regarding BMI, WC, and systolic and diastolic blood pressure (p = 0.480, p = 0.317, p = 0.376, and p = 0.325, respectively). Regarding ABI, there was a significant difference between T2DM patients with DFD compared to T2DM patients without DFD (p < 0.001), as shown in Table 1.
| Cases with T2DM with DFD | Cases with T2DM without DFD | Control group | p1 | p2 | p3 | |
|---|---|---|---|---|---|---|
| Duration of diabetes | ||||||
| Mean ± SD. | 8.05 ± 4.18 | 3.69 ± 1.47 | – | <0.001* | – | – |
| Waist circumference | ||||||
| Mean ± SD. | 93.80 ± 8.65 | 92.55 ± 8.98 | 89.66 ± 7.67 | 0.317 | <0.001* | 0.017* |
| BMI (kg/m 2 ) | ||||||
| Mean ± SD. | 29.29 ± 2.94 | 28.96 ± 3.0 | 27.24 ± 2.33 | 0.480 | <0.001* | <0.001* |
| Ankle brachial index (ABI) | ||||||
| Mean ± SD. | 0.83 ± 0.14 | 1.01 ± 0.04 | 1.03 ± 0.05 | <0.001* | <0.001* | 0.235 |
| Systolic blood pressure (mmHg) | ||||||
| Mean ± SD. | 134.1 ± 10.93 | 132.6 ± 12.20 | 119.3 ± 8.34 | 0.376 | <0.001* | <0.001* |
| Diastolic blood pressure (mmHg) | ||||||
| Mean ± SD. | 79.70 ± 9.18 | 81.0 ± 9.81 | 71.95 ± 7.15 | 0.325 | <0.001* | <0.001* |
Laboratory Parameters
There was no significant difference regarding ALT, serum creatinine, and eGFR between the three groups (p = 0.322, p = 0.680, and p = 0.419, respectively). However, UACR was significantly different between the groups (p < 0.001). There was no significant difference between group I and group II regarding TG and HDL (p = 0.250 and p = 0.067, respectively). However, group I showed significantly higher mean TC and LDL compared to group II (p < 0.001). There was a significant difference regarding FPG, 2h PPPG, and HbA1C between the groups; group I showed the highest mean and group III showed the lowest mean (p < 0.001), as shown in Table 2.
| Cases with T2DM with DFD | Cases with T2DM without DFD | Control group | p1 | p2 | p3 | |
|---|---|---|---|---|---|---|
| Fasting blood glucose (FBG) | ||||||
| Mean ± SD. | 193.2 ± 50.97 | 178.5 ± 53.98 | 88.99 ± 6.52 | 0.005* | <0.001* | <0.001* |
| 2 hours post prandial blood glucose (2H PPBG) | ||||||
| Mean ± SD. | 250.6 ± 56.63 | 234.0 ± 66.90 | 123.4 ± 9.99 | 0.009* | <0.001* | <0.001* |
| HbA1c | ||||||
| Mean ± SD. | 8.15 ± 0.68 | 7.93 ± 0.75 | 5.21 ± 0.21 | 0.002* | <0.001* | <0.001* |
| TC | ||||||
| Mean ± SD. | 203.1 ± 32.31 | 192.9 ± 35.68 | 151.3 ± 19.12 | 0.004* | <0.001* | <0.001* |
| TG | ||||||
| Mean ± SD. | 156.4 ± 28.58 | 152.0 ± 31.40 | 118.5 ± 15.41 | 0.250 | <0.001* | <0.001* |
| HDL-C | ||||||
| Mean ± SD. | 42.32 ± 5.29 | 43.74 ± 5.86 | 46.17 ± 4.88 | 0.067 | <0.001* | <0.001* |
| LDL-C | ||||||
| Mean ± SD. | 114.3 ± 37.39 | 94.15 ± 28.90 | 79.80 ± 10.80 | <0.001* | <0.001* | <0.001* |
| Serum Creatinine | ||||||
| Mean ± SD. | 0.72 ± 0.09 | 0.73 ± 0.09 | 0.73 ± 0.11 | >0.05 | >0.05 | >0.05 |
| eGFR | ||||||
| Mean ± SD. | 95.99 ± 4.07 | 95.17 ± 5.19 | 96.40 ± 8.88 | >0.05 | >0.05 | >0.05 |
| Urinary albumin/ Creatinine ratio (UACR) | ||||||
| Mean ± SD. | 69.18 ± 50.72 | 33.08 ± 27.78 | 15.91 ± 4.81 | <0.001* | <0.001* | <0.001* |
| ALT | ||||||
| Mean ± SD. | 27.12 ± 8.87 | 26.13 ± 9.13 | 25.71 ± 6.52 | >0.05 | >0.05 | >0.05 |
PAI-1 Levels
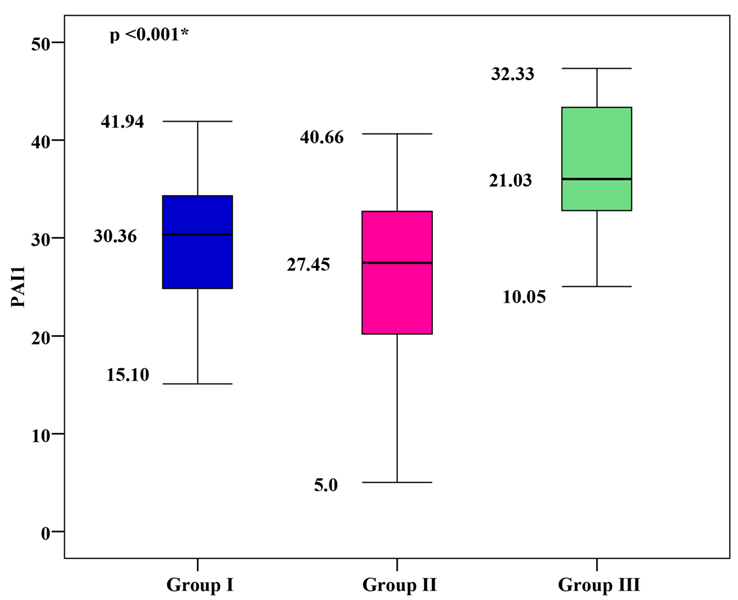
The mean PAI-1 was 29.76 ± 6.31 for group I, 25.78 ± 8.58 for group II, and 22.07 ± 6.12 for group III. Group I and group II showed significantly higher mean PAI-1 values than group III, with group I showing the highest mean PAI-1 (p < 0.001), as shown in Figure 1.


Correlation between Serum PAI-1 and Metabolic Control Parameters
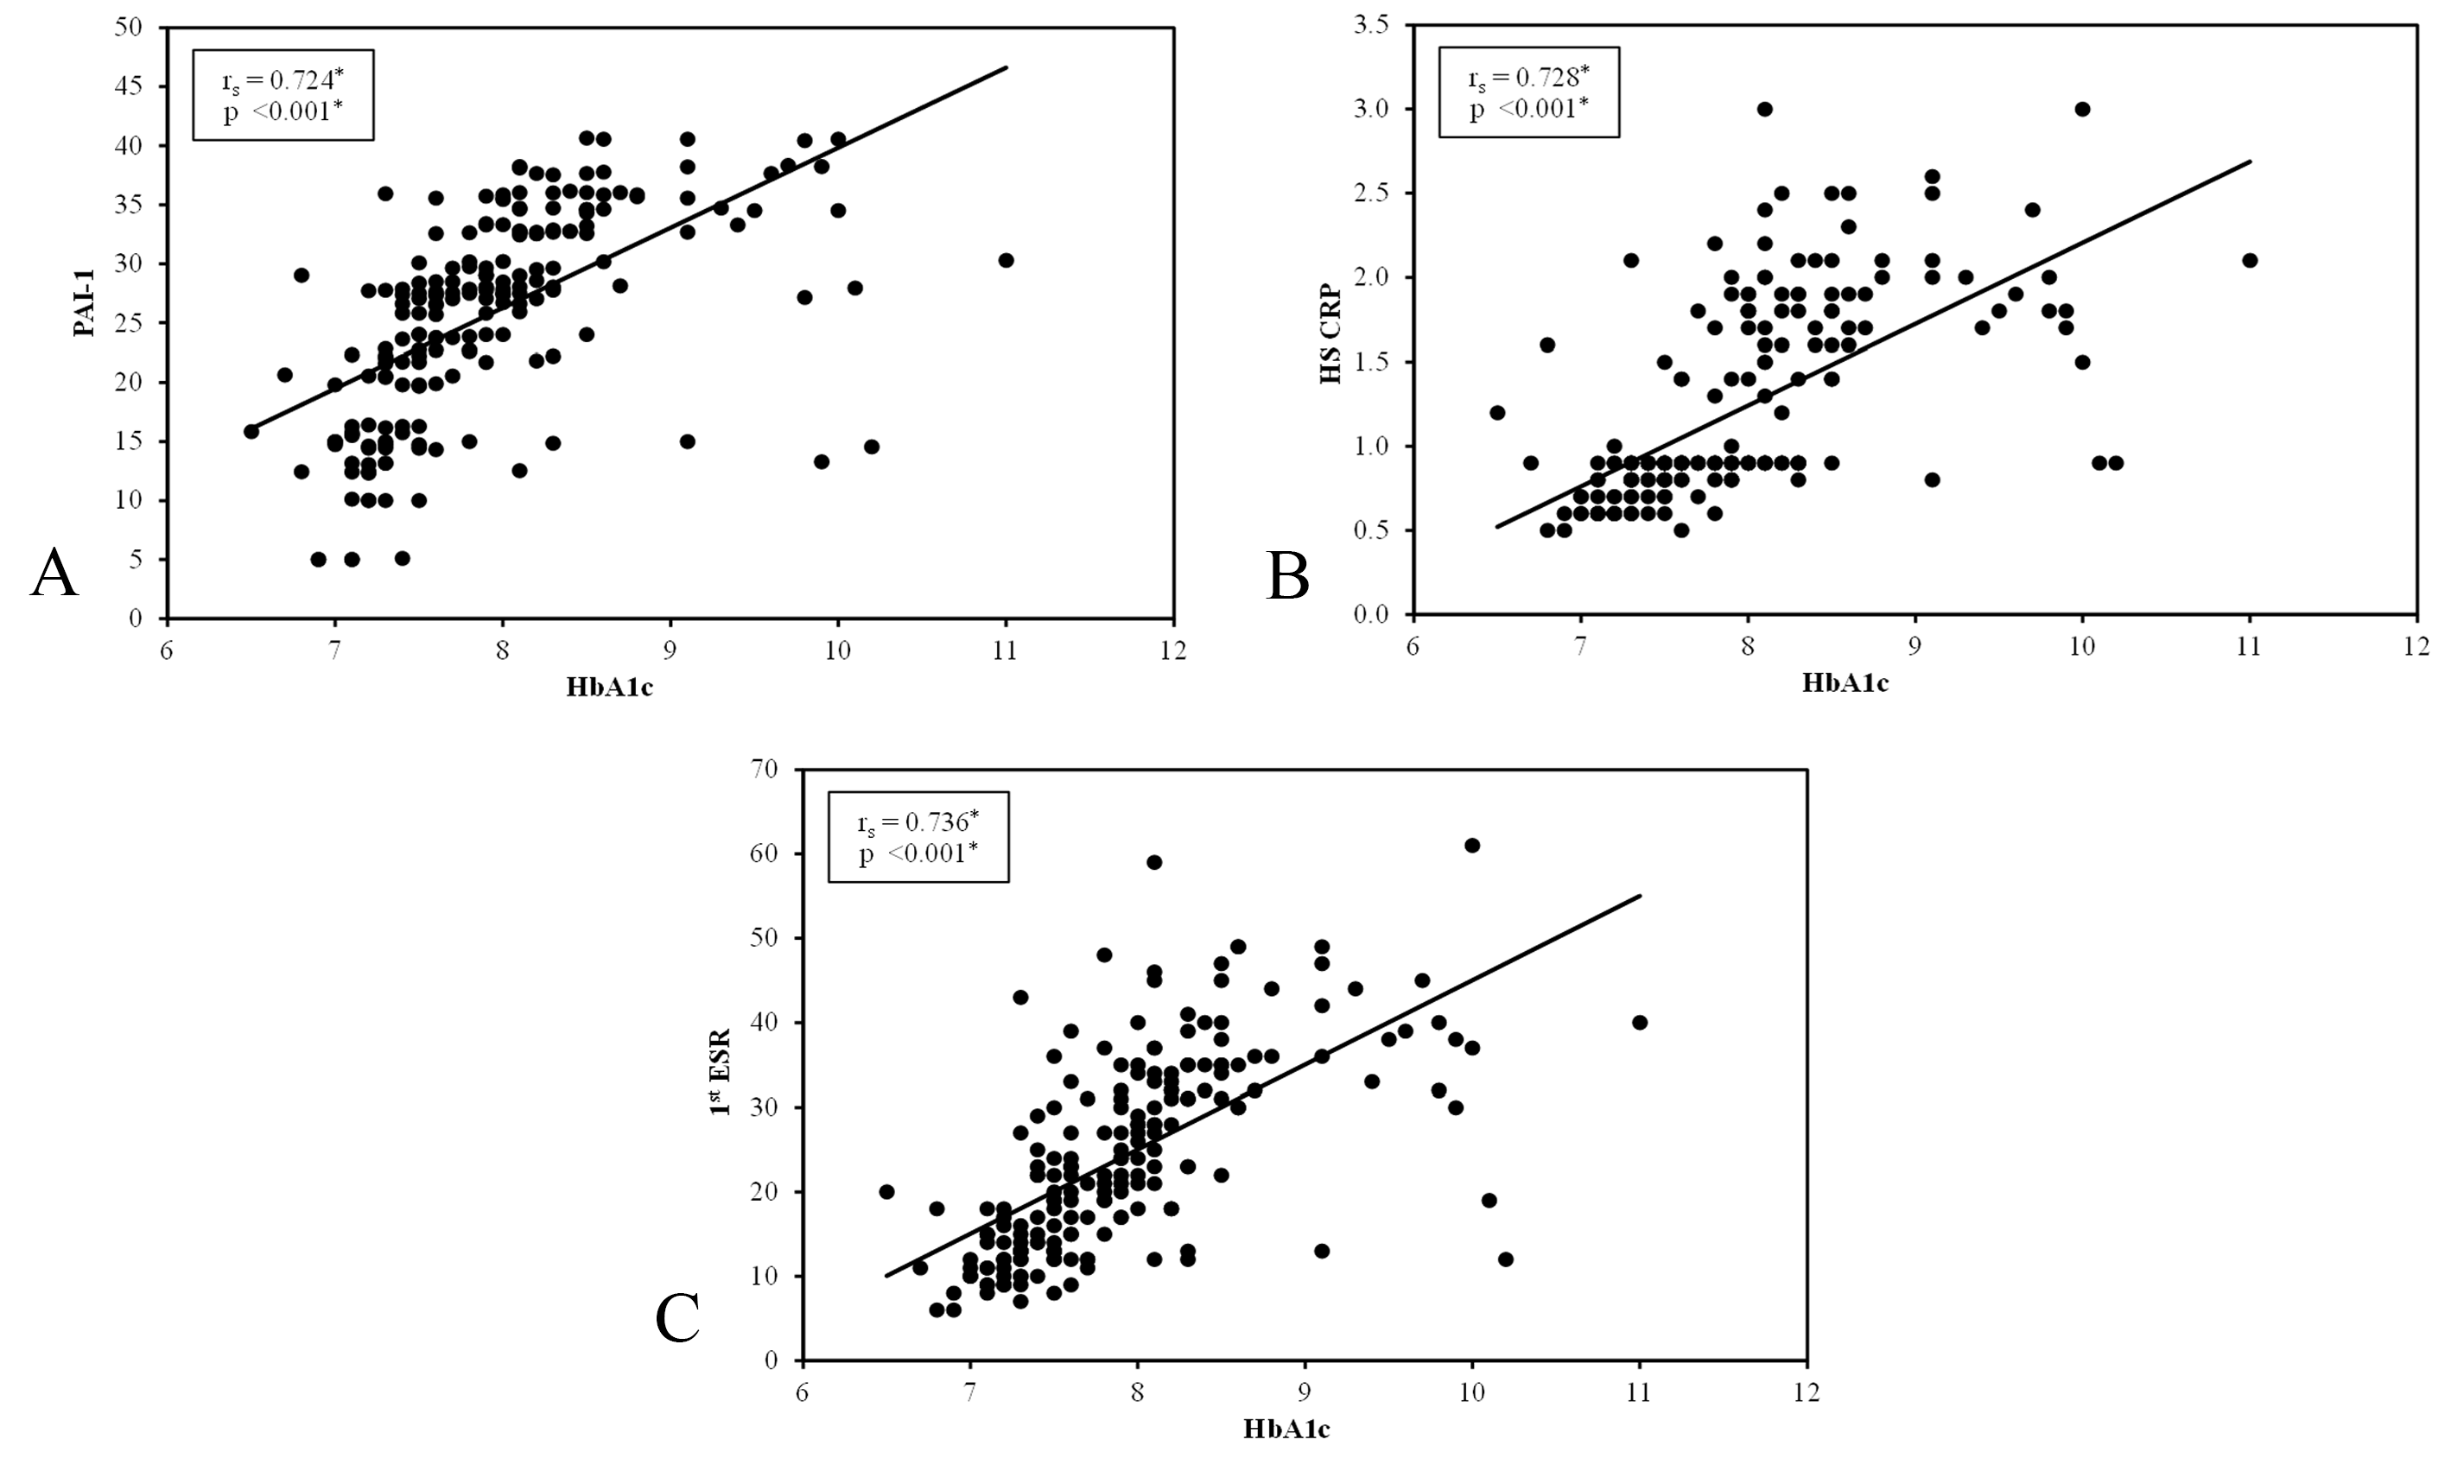
There was a significant positive correlation between PAI-1 and metabolic control parameters (including FPG, 2h PPPG and HbA1c), as well as duration of diabetes in group I and group II (p < 0.001). A significant positive correlation was found between PAI-1 and severity of DFD in group I (p < 0.001), as shown in Figure 2.
hs-CRP Levels
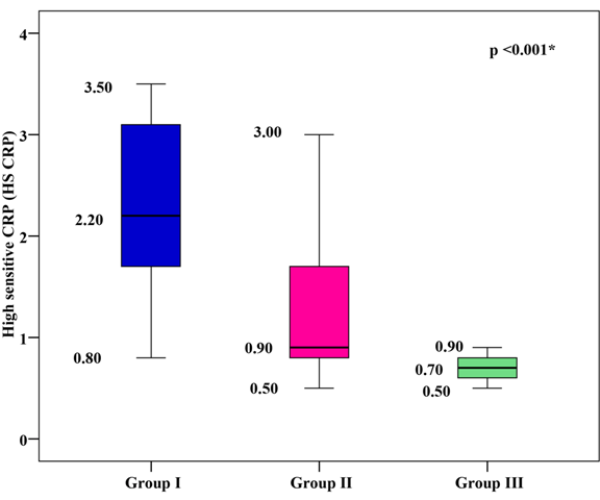
The mean hs-CRP was 2.29 ± 0.82 mg/dl for group I, 1.21 ± 0.57mg/dl for group II, and 0.69 ± 0.12 mg/dl for group III. Group I and group II showed significantly higher mean hs-CRP values than group III, with group I showing the highest mean hs-CRP (p < 0.001), as shown in Figure 3.
Correlation between Serum hs-CRP and Metabolic Control Parameters
There was a significant positive correlation between hs-CRP and metabolic control parameters (including FPG, 2h PPPG and HbA1c), as well as duration of diabetes in group I and group II (p < 0.001). A significant positive correlation was found between hs-CRP and severity of DFD in group I (p < 0.001), as shown in Figure 2.
1st hour ESR Levels
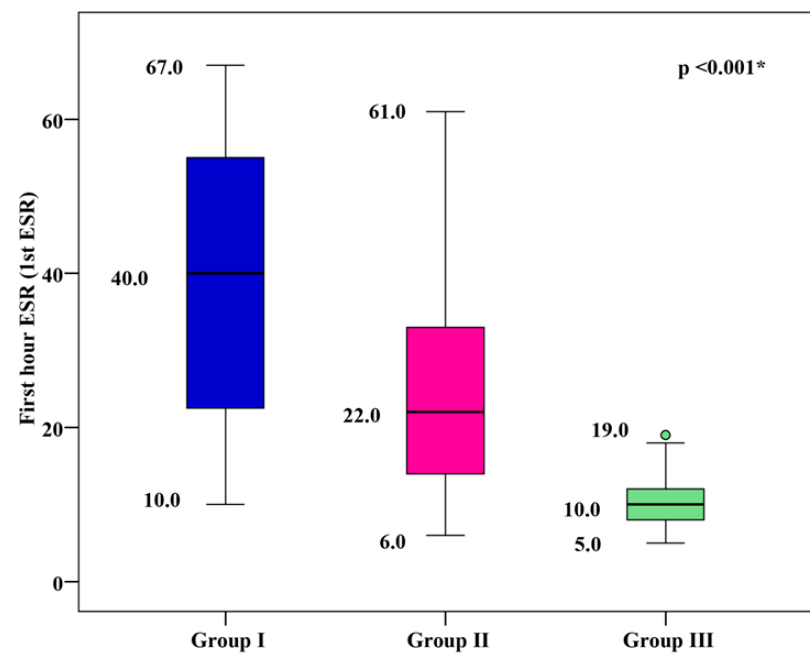
The mean 1st hour ESR was 39.18 ± 16.85 mm/h for group I, 24.33 ± 11.59 mm/h for group II, and 9.87 ± 2.81 mm/h for group III. Group I and group II showed significantly higher mean 1st hour ESR values than group III, with group I showing the highest mean 1st hour ESR (p < 0.001), as shown in Figure 4.
Correlation between Serum 1st Hour ESR and Metabolic Control Parameters
There was a significant positive correlation between 1st hour ESR and metabolic control parameters (including FPG, 2h PPPG, and HbA1c), as well as duration of diabetes in group I and group II (p < 0.001). A significant positive correlation was found between 1st hour ESR and severity of DFD in group I (p < 0.001), as shown in Figure 2.
ROC curve analysis for PAI-1, hs-CRP, and 1st hour ESR was performed to discriminate DFD from non-DFD. It was found that hs-CRP has greater diagnostic value in the detection of DFD; the area under the curve (AUC) of hs-CRP was 0.856, which was significant (p < 0.001) and revealed its better performance. The best hs-CRP cut-off point in this regard was more than 1.9 for the detection of DFD (with a sensitivity of 70.5%) and non-DFD (with a specificity of 87.0%). The positive and negative predictive values were 84.4 and 74.7, respectively.
The AUC of PAI-1 was 0.629, which was significant (p < 0.001). The cut-off point was more than 29.75 for the detection of DFD (with a sensitivity of 59.0%) and non-DFD (with a specificity of 67.50%). The positive and negative predictive values were 64.5 and 62.2, respectively.
The AUC of 1st hour ESR was 0.754, which was significant (p < 0.001). The cut-off point was more than 29 for the detection of DFD (with a sensitivity of 70.0%) and non-DFD (with a specificity of 65.0%). The positive and negative predictive values were 66.7 and 68.4, respectively, as shown in Figure 5.
Discussion
DM is a worldwide problem, and its prevalence is increasing25. In particular, T2DM is currently considered to be one of the major challenges to the healthcare system.
Chronic uncontrolled hyperglycemia is associated with microvascular and macrovascular complications, which both play an important role in DFD2. DFD is a major problem and is considered to be the most common cause of non-traumatic amputation in developing countries26.
In this study, we evaluated the link between inflammatory markers (including PAI-1, hs-CRP, and 1st hour ESR), metabolic control parameters (including FPG, 2h PPPG, and HbA1c), and DFD. The results showed that both groups of patients with T2DM had significantly higher mean serum levels of inflammatory markers (including PAI-1, hs-CRP, and 1st hour ESR) compared to the control group, and the mean level of inflammatory markers was higher in T2DM patients with DFD compared to T2DM patients without DFD, indicating that inflammatory markers play a role in DFD. In contrast to our findings, Kulwas et al.27 found that the difference in PAI-1 levels between diabetic patients with foot ulcers, those without foot ulcers, and the control group was not statistically significant. In agreement with our results, Weigelt et al.28 found that diabetic individuals with an acute foot ulcer had greater CRP levels than those without foot ulcers (p < 0.01), and Abolfotouh et al.29 observed 1st hour ESR levels greater than 60mm/hr in 70% of DFD patients, but in only 30% of non-DFD patients, which was statistically significant. (p = 0.002). In the present study, the mean serum levels of FPG, 2h PPPG, and HbA1C were significantly higher in T2DM patients with DFD compared to T2DM patients without DFD, indicating that poor metabolic control plays an important role in DFD. In agreement with our results, Kulwas et al.27 observed that HbA1C was >7% in diabetic patients with foot ulcers and <6.5% in those without foot ulcers group, and Hwang et al.30 found that HbA1c was 8% in diabetic patients with foot ulcers and 7.4% in those without foot ulcers. In our study, there was a significant positive correlation between inflammatory markers (including PAI-1, hs-CRP, and 1st hour ESR) and metabolic control parameters (including FPG, 2h PPPG, and HbA1C) in both groups of diabetic patients. In agreement with our study, PAI-1 and HbA1c—as well as RBG—were found to have substantial positive relationships in the study conducted by Adly et al.31. In another study, Romuk et al.32 found that PAI-1 expression was strongly and positively linked with HbA1c concentration in both diabetic groups (T1DM and T2DM), showing the impact of glycemic management on PAI-1 molecule expression. Increased hs-CRP in diabetic patients with complications or high PAI-1 was found by Adly et al.,31 which is in agreement with Coulon et al.,33 who discovered that CRP levels were three-fold higher in uncomplicated diabetic patients compared to controls and five-fold higher in diabetic patients with subclinical complications. Abolfotouh et al.29 used logistic regression analysis with the presence of DFD as the dependent variable to evaluate the risks of DFD in diabetic patients, after adjusting for age and gender, and found that peripheral neuropathic pain (PNP), duration of diabetes, and ESR level were significant predictors of DFD in diabetic patients.
Some limitations should be considered in our study. For example, it lacks generalizability in that it was only conducted at the Diabetes Clinic at Alexandria Main University Hospital. In addition, the duration of the study was relatively short (only 14 months). Furthermore, the study only included 500 patients, which is a relatively small sample size.
Conclusions
Inflammation is a potential therapeutic target and may be both a cause and an effect of DM and its complications. DFD is associated with elevated indicators of systemic and vascular inflammation. There was a high incidence of early chronic problems, which was linked to HbA1c and increased inflammatory biomarkers. We recommend that PAI-1, hs-CRP, and 1st hour ESR be considered as early predictors for vascular tissue damage which can be used for the early detection of complications in diabetic patients.
Abbreviations
ABI: Ankle brachial index, ACR: Albumin creatinine ratio, BMI: Body mass index , CHD: Coronary heart disease, DFS: Diabetic foot syndrome, DFD: Diabetic foot disease, DM:Diabetes mellitus, HSCRP: High sensitive CRP, Ist ESR: First hour ESR, IR: Insuline resistance, PAD: Peripheral arterial disease, PAI 1: Plasminogen activator inhibitor 1, T2DM: Type 2 diabetes mellitus, WC: Waist circumference
Acknowledgments
This work was supported by Internal Medicine Department (Diabetes Unit), Faculty of Medicine, Alexandria University, Egypt.
Author’s contributions
Study design (Fathi Z. Elsewy and Magdy H. Megalaa), Acquisition of data (Nader F Tadros), Laboratory tests supervision (Neveen L.Michael), Analysis and interpretation of data (Magdy H. Megalaa), drafting the article (Neveen L.Michael) and critical revision of the manuscript (Fathi Z. Elsewy and Magdy H. Megalaa). All authors read and approved the final manuscript.
Funding
None.
Availability of data and materials
Data and materials used and/or analyzed during the current study are available from the corresponding author on reasonable request.
Ethics approval and consent to participate
This study was conducted in accordance with the amended Declaration of Helsinki. The institutional review board approved the study, and all participants provided written informed consent.
Consent for publication
Not applicable.
Competing interests
The authors declare that they have no competing interests.
References
-
Standards of Medical Care in Diabetes-2016: summary of Revisions. Diabetes Care.
2016;
39 (Supplement_1)
:
S4-S5
.
View Article Google Scholar -
Chawla
R.,
Chawla
A.,
Jaggi
S.,
Chawla
A.,
Vascular Continuum of Complications in Type 2 Diabetes Mellitus- A Decade of Time Frame Experience. Endocrine Practice.
2016;
22
(S2)
:
64-5
.
View Article Google Scholar -
Tun
N.N.,
Arunagirinathan
G.,
Munshi
S.K.,
Pappachan
J.M.,
Diabetes mellitus and stroke: A clinical update. World Journal of Diabetes.
2017;
8
(6)
:
235-48
.
View Article PubMed Google Scholar -
Nather
A.,
Bee
C.S.,
Huak
C.Y.,
Chew
J.L.,
Lin
C.B.,
Neo
S.,
Epidemiology of diabetic foot problems and predictive factors for limb loss. Journal of Diabetes and Its Complications.
2008;
22
(2)
:
77-82
.
View Article PubMed Google Scholar -
Koblik
T.,
Early detection of diabetic foot syndrome. Diab Prakt.
2009;
9
(1)
:
48-53
.
-
van Houtum
W.H.,
Rauwerda
J.A.,
Ruwaard
D.,
Schaper
N.C.,
Bakker
K.,
Reduction in diabetes-related lower-extremity amputations in The Netherlands: 1991-2000. Diabetes Care.
2004;
27
(5)
:
1042-6
.
View Article PubMed Google Scholar -
Association
American Diabetes,
Microvascular Complications and Foot Care: Standards of Medical Care in Diabetes-2019. Diabetes Care.
2019;
42
:
124-38
.
View Article PubMed Google Scholar -
Urano
T.,
Castellino
F.J.,
Suzuki
Y.,
Regulation of plasminogen activation on cell surfaces and fibrin. Journal of Thrombosis and Haemostasis.
2018;
16
(8)
:
1487-97
.
View Article PubMed Google Scholar -
Aso
Y.,
Plasminogen activator inhibitor (PAI)-1 in vascular inflammation and thrombosis. Frontiers in Bioscience.
2007;
12
(8-12)
:
2957-66
.
View Article PubMed Google Scholar -
Song
C.,
Burgess
S.,
Eicher
J.D.,
O'Donnell
C.J.,
Johnson
A.D.,
Huang
J.,
Causal Effect of Plasminogen Activator Inhibitor Type 1 on Coronary Heart Disease. Journal of the American Heart Association.
2017;
6
(6)
:
e004918
.
View Article PubMed Google Scholar -
Naran
N.H.,
Chetty
N.,
Crowther
N.J.,
The influence of metabolic syndrome components on plasma PAI-1 concentrations is modified by the PAI-1 4G/5G genotype and ethnicity. Atherosclerosis.
2008;
196
(1)
:
155-63
.
View Article PubMed Google Scholar -
Trost
S.,
Pratley
R.,
Sobel
B.,
Impaired fibrinolysis and risk for cardiovascular disease in the metabolic syndrome and type 2 diabetes. Current Diabetes Reports.
2006;
6
(1)
:
47-54
.
View Article PubMed Google Scholar -
Meigs
J.B.,
O'donnell
C.J.,
Tofler
G.H.,
Benjamin
E.J.,
Fox
C.S.,
Lipinska
I.,
Hemostatic markers of endothelial dysfunction and risk of incident type 2 diabetes: the Framingham Offspring Study. Diabetes.
2006;
55
(2)
:
530-7
.
View Article PubMed Google Scholar -
Klein
R.L.,
Semler
A.J.,
Baynes
J.W.,
Thorpe
S.R.,
Lyons
T.J.,
Jenkins
A.J.,
Glycation does not alter LDL-induced secretion of tissue plasminogen activator and plasminogen activator inhibitor-1 from human aortic endothelial cells. Annals of the New York Academy of Sciences.
2005;
1043
(1)
:
379-89
.
View Article PubMed Google Scholar -
Hu
X.,
Zan
X.,
Xie
Z.,
Li
Y.,
Lin
S.,
Li
H.,
Association Between Plasminogen Activator Inhibitor-1 Genetic Polymorphisms and Stroke Susceptibility. Molecular Neurobiology.
2017;
54
(1)
:
328-41
.
View Article PubMed Google Scholar -
Casadei
K.,
Kiel
J.,
Anthropometric MeasurementStatPearls Publishing: Treasure Island; 2021.
Google Scholar -
Gavriilidou
N.N.,
Pihlsgard
M.,
Elmstahl
S.,
Anthropometric reference data for elderly Swedes and its disease-related pattern. European Journal of Clinical Nutrition.
2015;
69
(9)
:
1066-75
.
View Article PubMed Google Scholar -
Shirazi
A. Arsanjani,
Nasiri
M.,
Yazdanpanah
L.,
Dermatological and musculoskeletal assessment of diabetic foot: A narrative review. Diabetes & Metabolic Syndrome.
2016;
10
(2)
:
158-64
.
View Article PubMed Google Scholar -
Vas
P.R.,
Edmonds
M.E.,
Early recognition of diabetic peripheral neuropathy and the need for one-stop microvascular assessment. The Lancet. Diabetes & Endocrinology.
2016;
4
(9)
:
723-5
.
View Article PubMed Google Scholar -
Brownrigg
J.R.,
Hinchliffe
R.J.,
Apelqvist
J.,
Boyko
E.J.,
Fitridge
R.,
Mills
J.L.,
Foot
International Working Group on the Diabetic,
Effectiveness of bedside investigations to diagnose peripheral artery disease among people with diabetes mellitus: a systematic review. Diabetes Metabolism Research and Reviews.
2016;
32
:
119-27
.
View Article PubMed Google Scholar -
Brownrigg
J.R.,
Schaper
N.C.,
Hinchliffe
R.J.,
Diagnosis and assessment of peripheral arterial disease in the diabetic foot. Diabetic Medicine.
2015;
32
(6)
:
738-47
.
View Article PubMed Google Scholar -
Roberts
N.B.,
Amara
A.B.,
Morris
M.,
Green
B.N.,
Long-term evaluation of electrospray ionization mass spectrometric analysis of glycated hemoglobin. Clinical Chemistry.
2001;
47
(2)
:
316-21
.
View Article PubMed Google Scholar -
Zheng
N.,
Shi
X.,
Chen
X.,
Lv
W.,
Associations Between Inflammatory Markers, Hemostatic Markers, and Microvascular Complications in 182 Chinese Patients With Type 2 Diabetes Mellitus. Laboratory Medicine.
2015;
46
(3)
:
214-20
.
View Article PubMed Google Scholar -
Association
American Diabetes,
Microvascular Complications and Foot Care: Standards of Medical Care in Diabetes-2018. Diabetes Care.
2018;
41
:
105-18
.
View Article PubMed Google Scholar -
Dagenais
G.R.,
Gerstein
H.C.,
Zhang
X.,
McQueen
M.,
Lear
S.,
Lopez-Jaramillo
P.,
Variations in Diabetes Prevalence in Low-, Middle-, and High-Income Countries: Results From the Prospective Urban and Rural Epidemiological Study. Diabetes Care.
2016;
39
(5)
:
780-7
.
View Article PubMed Google Scholar -
Ang
Y.,
Yap
C.,
Saxena
N.,
Lin
L.,
Heng
B.,
Diabetes-related lower extremity amputations in Singapore. Proceeding Singapore Healt.
2017;
26
(2)
:
76-80
.
View Article Google Scholar -
Kulwas
A.,
Lisewska
B.,
Jundzi\l\l
W.,
Ruszkowska
B.,
Drewniak
W.,
Ruprecht
Z.,
Tissue plasminogen activator (t-PA) and plasminogen activator inhibitor type 1 (PAI-1) in diabetic foot syndrome. Advances in Medical Sciences.
2017;
62
(1)
:
87-91
.
View Article PubMed Google Scholar -
Weigelt
C.,
Rose
B.,
Poschen
U.,
Ziegler
D.,
Friese
G.,
Kempf
K.,
Immune mediators in patients with acute diabetic foot syndrome. Diabetes Care.
2009;
32
(8)
:
1491-6
.
View Article PubMed Google Scholar -
Abolfotouh
M.A.,
Alfaifi
S.A.,
Al-Gannas
A.S.,
Risk factors of diabetic foot in central Saudi Arabia. Saudi Medical Journal.
2011;
32
(7)
:
708-13
.
PubMed Google Scholar -
Hwang
D.J.,
Lee
K.M.,
Park
M.S.,
Choi
S.H.,
Park
J.I.,
Cho
J.H.,
Association between diabetic foot ulcer and diabetic retinopathy. PLoS One.
2017;
12
(4)
:
e0175270-e
.
View Article PubMed Google Scholar -
Adly
A.A.,
Elbarbary
N.S.,
Ismail
E.A.,
Hassan
S.R.,
Plasminogen activator inhibitor-1 (PAI-1) in children and adolescents with type 1 diabetes mellitus: relation to diabetic micro-vascular complications and carotid intima media thickness. Journal of Diabetes and Its Complications.
2014;
28
(3)
:
340-7
.
View Article PubMed Google Scholar -
Romuk
E.,
Jagosz
J.,
Wojciechowska
C.,
Strojek
K.,
Birkner
E.,
Evaluation of VCAM-1 and PAI-1 concentration in diabetes mellitus patients. Exp Clin Diabetol.
2008;
8
(2)
:
85-9
.
-
Coulon
J.,
Willems
D.,
Dorchy
H.,
[Increase in C-reactive protein plasma levels during diabetes in infants and young adults]. Presse Medicale (Paris, France).
2005;
34
(2 Pt 1)
:
89-93
.
View Article PubMed Google Scholar
Comments
Article Details
Volume & Issue : Vol 9 No 3 (2022)
Page No.: 4986-4995
Published on: 2022-03-31
Citations
Copyrights & License
This work is licensed under a Creative Commons Attribution 4.0 International License.
Search Panel
Pubmed
Google Scholar
Pubmed
Google Scholar
Pubmed
Google Scholar
Pubmed
Search for this article in:
Google Scholar
Researchgate
- HTML viewed - 4605 times
- PDF downloaded - 1632 times
- XML downloaded - 0 times
