

Copyrights: Supaporn Khamchun, Keeratikarn Suangpho, Narudee Promma, 2022. License: This work is licensed under a Creative Commons Attribution 4.0 International License.
Abstract
Background: Apoptosis is one of the crucial processes related to pathogenesis and disease severity in systemic lupus erythematosus (SLE). Previous studies have reported changes in protein levels in the sera and plasma of SLE patients. The capacity of these serum molecules to induce the apoptosis of circulating cells remains unclear. The present study investigates the effect of SLE patients’ sera on the apoptosis of mononuclear cells and explores serum and plasma proteins related to apoptotic mechanisms.
Methods: Peripheral blood mononuclear cells (PBMCs) from healthy individuals were isolated and H2O2 concentrations and incubation time points for optimal stimulation of cell death were determined. The PBMCs were treated with sera from SLE patients (N=12) and healthy individuals (N=12) with or without H2O2 induction. The level of cell death and apoptosis in both the early and late phases was examined by staining with trypan blue and annexin-V/PI, respectively. Finally, the altered serum and plasma proteins from SLE patients reported in previous publications were comprehensively collected, their associations with apoptotic mechanisms were analyzed using the STRING bioinformatics tool, and their increased serum levels in SLE patients were validated by ELISA assay.
Results: We applied 0.2 mM H2O2 for 48 hours as a chemical inducer of apoptosis in PBMCs. After the intervention, PBMCs exposed to SLE serum had significantly increased cell death and early- and late-phase apoptosis compared with those exposed to the sera of healthy controls both with and without H2O2 induction (p < 0.05). Moreover, STRING analysis revealed that 14 of the 45 collected proteins from SLE patients’ sera and plasma in several previous proteomics studies were intimately associated with the apoptotic process and regulation of apoptosis, including high mobility group box chromosomal protein 1 (HMGB1), interleukin-6 (IL-6), and clusterin (CLU). Finally, the level of serum IL-6, one of the candidate altered proteins in SLE patients, was found to be significantly increased compared with healthy controls (p < 0.05).
Conclusions: The serum of SLE patients can influence the death of mononuclear cells through the early and late phases of apoptosis. Furthermore, SLE patients’ sera was found to contain 14 altered proteins involved in the process of apoptosis, possibly as crucial factors for the progression of SLE.
Introduction
Systemic lupus erythematosus (SLE) is a chronic multisystem autoimmune disease that affects various organ systems through an abnormal immune response that leads to multi-organ damage and failure. SLE is a prototypic systemic autoimmune disease with a high rate of incidence, prevalence, and mortality in the global population1, 2. The pathogenesis of SLE includes several factors, such as genetic susceptibility, environmental chemicals, radiation, and infection, resulting in the production of autoreactive antibodies from self-tolerance defects. These autoantibodies can bind to nuclear self-antigens and further activate the complement cascade, leading to inflammation and progression to an active state in patients3, 4. Moreover, the increased amount of nuclear self-antigens has been found to be a crucial factor in the development of SLE disease severity. One mechanism in the formation of nuclear antigens bound to antibodies, such as Ro/SSA, La/SSB, and single- and double-stranded deoxyribonucleic acid (DNA) autoantigens in SLE patients, was found to result from the process of cell apoptosis5, 6.
Apoptosis as a process of programmed cell death that has an essential role in the elimination of dysfunctional or abnormal cells and is involved in the development and maintenance of homeostasis in the human body. This process is initiated by several factors through extrinsic or intrinsic pathways, leading to the activation of the caspase enzyme cascade and further modification of biochemical and morphological features of the cells. Apoptosis is generally characterized by cell shrinkage, chromatin condensation, DNA fragmentation, phosphatidylserine (PS) externalization, and cell membrane blebbing7, 8. Changes in cell morphology that occur during apoptosis result in the exposure of nuclear antigens within the cells to the immune system, activation of an immune response, and development of autoimmunity. However, apoptosis is regulated by various related genes and can be eliminated by phagocytic cells, especially monocytes and macrophages, which can alter the process5, 6.
Recent reports established that SLE patients have an accelerated rate of cell apoptosis and defective clearance of apoptotic debris by phagocytosis. These apoptotic process abnormalities are also intimately correlated with the progression of disease severity. Patients with SLE were found to have an increased apoptotic rate in mononuclear cells (lymphocytes and monocytes) compared with healthy individuals and exhibited delayed clearance of these apoptotic cells in circulating blood9, 10, 11. Moreover, it has been suggested that soluble components in the sera of SLE patients represent important factors that influence the apoptotic process in leukocytes and result in an increased number of circulating nuclear antigens that are available to induce an immune response in these patients12, 13. Furthermore, the levels of various serum proteins in SLE patients have been demonstrated to be altered when compared with healthy individuals, and some of these proteins may have an inducing effect on cell apoptosis, which has a role in the pathogenesis and exacerbation of SLE. The present study investigates whether the sera of SLE patients can accelerate the apoptotic process in mononuclear cells, both with and without chemical induction of apoptosis by reactive oxygen species (ROS). The study also explores the altered proteins in SLE patients and their potential as candidate serum factors involved in the apoptotic mechanisms associated with disease development.
Methods
Recruitment of subjects
The participants included 12 SLE patients, aged between 20 and 50 years, who were recruited as the subjects of this study. All the patients had previously been diagnosed with SLE according to the criteria of the European League Against Rheumatism (EULAR)/American College of Rheumatology (ACR). The inclusion criteria were as follows: aged between 20 and 50 years and diagnosed with SLE according to EULAR/ACR criteria within 1 month prior to enrolment in the study. Patients who received immunosuppressive drugs, anti-inflammatory drugs, or had other diseases related to SLE, such as systemic inflammatory diseases or autoimmune diseases (e.g., rheumatoid arthritis, Sjogren's syndrome), were excluded from the study. Healthy age- and sex-matched individuals who had no illnesses and no cognitive or chronic diseases, namely systemic inflammatory diseases or autoimmune diseases, were recruited as controls. The sample size of the patients and controls in this study was calculated based on the SLE disease prevalence in Thailand.
Collection of blood and isolation of serum samples
Blood samples were collected from the median cubital vein of individual participants using standard venipuncture with aseptic technique. The collection of blood samples from each SLE patient (N=12) was performed using vacutainer tubes containing clot activator (Becton Dickinson; Franklin Lakes, NJ). The collection of blood samples from each healthy control subject (N=12) was conducted using both vacutainer tubes containing clotting factor and heparin anticoagulant solution (Becton Dickinson; Broken bow, NE) for further isolation of serum and peripheral blood mononuclear cells (PBMCs), respectively.
To isolate the serum samples, clotted blood derived from SLE patients and healthy control subjects was centrifuged at 1,800 g for 5 minutes. Then, individual serum samples were carefully collected, aliquoted, and stored at ‑80 °C until use.
Isolation of PBMCs by Ficoll-Hypaque density gradient centrifugation
PBMCs were isolated from the peripheral blood of healthy control subjects using Ficoll-Hypaque density gradient centrifugation. Briefly, anticoagulated blood was diluted with an equal volume of phosphate-buffered saline (PBS) (pH 7.4). The diluted blood was then continuously layered over LyphoprepTM solution with a density of 1.077 g/mL (Stemcell Technologies; Vancouver, Canada). This solution was promptly centrifuged at 400 g at 25°C for 30 minutes. Subsequently, the PBMC interface between the Ficoll-Paque solution and plasma was carefully collected and washed once with PBS via centrifugation at 300 g at 25°C for 5 minutes. The PBMC pellet was then resuspended in a red blood cell (RBC)-lysing buffer (Sigma; St. Louis, MO) and incubated at 25°C for 10 minutes with gentle mixing to lyse any contaminating RBCs. Thereafter, the decontaminated PBMCs were washed with PBS twice via centrifugation at 300 g at 25°C for 5 minutes, and measurement of cell viability and PBMC number was performed via hemocytometer-based trypan blue staining assay.
Induction of cytotoxicity by H2O2
The isolated PBMCs were plated at a density of 1×10⁵ cells/ml in RPMI medium supplemented with 100 U/ml penicillin G and 100 mg/ml streptomycin (Sigma; St. Louis, MO), and maintained in a humidified incubator at 37°C with 5% CO2 for 24 hours. The cells were then incubated with 0.2, 1, and 5 mM of H2O2 (Alfa aesar; Lancashire, United Kingdom) in a humidified incubator at 37°C with 5% CO2 for 3, 10, 24, or 48 hours. The capacity of H2O2 at various concentrations to induce PBMC cytotoxicity at each time point was measured via trypan blue staining assay. Untreated cells served as the control.
Treatment of the cells with serum samples
After investigating the cytotoxic activity of H2O2 for the selection of optimal concentration and incubation time, the PBMCs were treated with serum samples. Briefly, cells from healthy individuals that were induced or not induced with 0.2 mM of H2O2 were incubated with serum samples from SLE patients and healthy controls in a humidified incubator at 37°C with 5% CO2 for 24 hours. Next, the effect of the SLE patients’ sera on promoting cell death and apoptosis was determined and compared with the healthy control subjects via trypan blue and annexin-V/PI-staining assay, respectively.
Cell death and total cell number measurement by trypan blue staining assay
Trypan blue staining assay based on a hemacytometer was applied to examine the degree of cell death and total cell numbers. The isolated PBMCs (1×10⁵ cells/ml) were cultured in RPMI medium containing the sera of SLE patients and healthy controls with or without H2O2 induction in a 96-well plate. The cells were then collected and washed twice with PBS (pH 7.4). After resuspension in PBS, the suspension was mixed with 0.4% trypan blue solution (Gibco; Grand Island, NY) and the cells were counted using a hemacytometer counting chamber; cells that were stained by trypan blue represented dead cells. The percentage of cell death and total cell number were calculated using the following formulae:
Cell death (%) = [Number of trypan blue-positive cells × 100] / Total cell number
Total cell number (cells/ml) = [Number of viable cells × dilution factor x 104] / 4
Cell apoptosis measurement by annexin-V/PI staining assay
To determine the degrees of both early- and late-phase apoptosis, annexin-V/PI staining assay followed by fluorescence was performed. The isolated PBMCs (1×10⁵ cells/ml) were cultured in RPMI medium that contained sera from SLE patients and healthy controls with or without H2O2 induction in a 24-well plate. The cells were collected and washed twice with PBS (pH 7.4). The cell pellet was resuspended with annexin-V-FLUOS labeling solution (annexin-V-fluorescein and PI) (Roche Diagnostics; Rotkreuz, Switzerland) and incubated at 25°C for 15 minutes. The stained cells were later observed under an upright fluorescence microscope (Optika; Ponteranica, Italy) with a digital camera. The fluorescence intensity of fluorescein and PI of 100 individual cells in each condition were measured using Proview software version x64 (Optika; Ponteranica, Italy).
Data retrieval of serum and plasma proteins
The proteomics data of serum or plasma proteins from SLE patients were collected from all published articles cited on PubMed, MEDLINE, and ScienceDirect databases between 2005 and 2020 using the search terms “serum/plasma protein of SLE” or “serum/plasma proteomic data of SLE.” All the serum or plasma proteins in SLE patients were reported at abnormal levels (higher or lower) compared with healthy individuals in the collected proteomics data, which reported based on name, gene symbol, and molecular weight.
Biological prediction by bioinformatics tools
All the altered serum or plasma proteins in SLE patients collected from the published articles predicted the biological functions involved in the process of cell apoptosis using the global network analysis relative to the gene ontology (GO) terms. The gene symbols of all collected proteins were submitted with medium stringency and confidence level (score ≥ 0.400) to Search Tool for the Retrieval of Interacting Gene/Proteins (STRING) version 11.0 (https://string-db.org).
Interleukin 6 level measurement by enzyme-linked immunosorbent assay
The levels of IL-6 in the sera of SLE patients and healthy controls were measured using a human IL-6 duoSet ELISA kit (R & D systems; Minneapolis, MN) following the manufacturer’s instructions. Briefly, 100 µl of the working concentration of capture antibody was added to a 96-well MaxiSorp™ flat-bottom plate (Thermo Fisher Scientific; Waltham, MA) and incubated overnight at 25°C. The plate was washed twice with washing buffer (0.05% Tween-PBS) and blocked with 1% BSA-PBS at 25°C for 1 hour. The plate was then washed twice with washing buffer. Subsequently, 100 µl of various standard concentrations of IL-6 and serum samples from SLE patients (N=12) and healthy controls (N=12) were added to each well of the microplate. The plate was incubated at 25°C for 2 hours and washed twice with washing buffer. Thereafter, 100 µl of the working concentration of the detection antibody was added to the plate, incubated at 25°C for 2 hours, and washed twice with washing buffer. To each well of the plate, we subsequently added 100 µl of the working dilution of streptavidin-HRP, incubated at 25°C in the dark for 20 minutes, and washed twice with washing buffer. Thereafter, 100 µl of substrate solution (TMB) was added to each well and incubated at 25°C in the dark for 10 minutes. Finally, 50 µl of stop solution was added to each well and the absorbance was examined at a wavelength of 450 nm using a microplate reader.
Statistical analysis
Quantitative data were reported as mean ± standard deviation (SD). Comparison between the two examined groups was investigated by unpaired Student’s t test, whereas multiple comparisons were performed using one-way analysis of variance (ANOVA) with Tukey’s post-hoc test using SPSS statistical software, version 25 (IBM; North Castle, NY). A p-value less than 0.05 was considered statistically significant.
| Clinical parameters | Healthy controls | SLE patients |
|---|---|---|
| Demographics | ||
| Sex, F/M | 12/0 | 12/0 |
| Age (years), Mean ± SD | 36.62 ± 3.48 | 39.38 ± 13.19 |
| Disease status | - | |
| Duration (years), Mean ± SD | - | 11.92 ± 7.24 |
| Rash, n (%) | - | 3 (25.00%) |
| Arthritis, n (%) | - | 7 (58.33%) |
| Nephritis, n (%) | - | 5 (41.67%) |
| Thrombocytopenia, n (%) | - | 2 (16.67%) |
| ANA (> 1:80), n (%) | - | 12 (100.00%) |
| Drug treatment (prednisolone, azathioprine, hydroxychloroquine, etc.), n (%) | - | 10 (83.33%) |
Results
Demographic data of the patients
The study participants consisted of 12 SLE patients and healthy controls. All the SLE patients had been previously diagnosed according to the EULAR/ACR criteria for SLE. In addition, 12 non-pregnant Thai women with no illness, history of illness, or clinical manifestations of cognitive or chronic diseases, especially systemic inflammatory diseases or autoimmune diseases, were selected as matching comparative controls. The demographic information and disease status of the healthy controls and SLE patients at the time of the study are summarized in Table 1. The data demonstrated that there were no significant differences in terms of sex and age between the healthy control group (all female, 33 – 41 years old) and the SLE test group (all female, 26 – 53 years old). In all the SLE patients, the mean (range) duration of disease was approximately 12 years (4 – 20 years). Among the 12 patients, 3 (25%) had clinical manifestation with rash, 7 (58.33%) had arthritis, 5 (41.67%) had nephritis, and 2 (16.67%) had thrombocytopenia. Moreover, all the patients (100%) had laboratory results with critical antinuclear antibody (ANA) titer of more than 80, and 10 patients (83.33%) had received drug treatments, including both steroids (e.g., prednisolone) and nonsteroidal agents (e.g., azathioprine and hydroxychloroquine).


| No. | Protein name | Gene name | Reference | Level in SLE | Biological process (Gene ontology) | |
|---|---|---|---|---|---|---|
| Apoptotic process | Regulation of apoptosis | |||||
| 1 | A proliferation-inducing ligand | APRIL | Koyama T, et al. (2005) 22 | Increased | ||
| 2 | Tumor necrosis factor-α-induced protein-8 like-2 | TNFAIP8L2 | Li D, et al. (2009) 23 | Decreased | ||
| 3 | High mobility group box chromosomal protein 1 | HMGB1 | Li J, et al. (2010) 24 | Increased | ||
| 4 | Interleukin-33 | IL-33 | Yang Z, et al. (2011) 25 | Increased | ||
| 5 | RANTES (regulated upon activation, normal T cell expressed and secreted) | CCL5 | Lu MM, et al. (2012) 26 | Increased | ||
| 6 | Serum L-ficolin | FCN2 | Watanabe H, et al. (2012) 27 | Decreased | ||
| 7 | Interleukin-9 | IL-9 | Ouyang H, et al. (2013) 28 | Increased | ||
| 8 | Interleukin-37 | IL- 37 | Ye L, et al. (2014) 29 | Increased | ||
| 9 | Growth arrest-specific 6 | Gas6 | Bakr SI, et al. (2015) 30 | Increased | ||
| 10 | Heat shock protein beta-1 (Heat shock protein 27) | HSPB1 | Rai R, et al. (2015) 31 | Decreased | ||
| 11 | Tumor necrosis factor receptor superfamily 13C (BLyS receptor 3) | TNFSF13C | Duan JH, et al. (2016) 32 | Decreased | ||
| 12 | Tyrosine-protine kinase receptor UFO | Axl | Mok CC, et al. (2016) 33 | Increased | ||
| 13 | Ferritin | FTH1 | Increased | |||
| 14 | Insulin like growth factor binding protein 2 | IGFBP2 | Increased | |||
| 15 | Tumor necrosis factor receptor 2 | TNFRSF1B | Increased | |||
| 16 | C-reactive protein | CRP | Umare et al. (2017) 34 | Increased | ||
| 17 | Interleukin-6 | IL-6 | Increased | |||
| 18 | Thrombospondin-4 | THBS4 | Zhong L, et al. (2017) 35 | Increased | ||
| 19 | Properdin | CFP | Increased | |||
| 20 | Collectin-11 | COLEC11 | Increased | |||
| 21 | Matrix metalloproteinase 7 | MMP-7 | Vira H, et al. (2017) 36 | Increased | ||
| 22 | Leucine-rich α2-glycoprotein | LRG | Ahn SS, et al. (2018) 37 | Increased | ||
| 23 | BTB domain and CNC homolog 2 | BACH2 | Zhu Z, et al. (2018) 38 | Decreased | ||
| 24 | Serotransferrin | TF | Madda R, et al. (2018) 39 | Increased | ||
| 25 | Clusterin | CLU | Decreased | |||
| 26 | Apolipoprotein A1 | APOA1 | Decreased | |||
| 27 | Apolipoprotein A2 | APOA2 | Decreased | |||
| 28 | Alpha-2-macroglobulin | A2M | Increased | |||
| 29 | Transthyretin | TTR | Decreased | |||
| 30 | Alpha-1-acid glycoprotein 1 | ORM1 | Increased | |||
| 31 | Alpha-1-acid glycoprotein 2 | ORM2 | Increased | |||
| 32 | Alpha-1-B glycoprotein | A1BG | Increased | |||
| 33 | Alpha-1-antitrypsin | SERPINA1 | Increased | |||
| 34 | Alpha-1-antichymotrypsin | SERPINA3 | Increased | |||
| 35 | Hemopexin | HPX | Decreased | |||
| 36 | Hemoglobin beta subunit | HBB | Increased | |||
| 37 | Haptoglobin | HP | Increased | |||
| 38 | Ceruloplasmin | CP | Increased | |||
| 39 | Interleukin-34 | IL-34 | Increased | |||
| 40 | Fibrinogen beta chain | FGB | Decreased | |||
| 41 | Apolipoprotein B | APOB | Increased | |||
| 42 | Aryl hydrocarbon receptor | AhR | Yu H, et al. (2019) 40 | Increased | ||
| 43 | Fms related receptor tyrosine kinase 3 ligand | FLT3LG | Yuan X, et al. (2019) 41 | Decreased | ||
| 44 | Cytotoxic T-lymphocyte-associated protein 4 | CTLA4 | Zhao L, et al. (2020) 42 | Decreased | ||
| 45 | C-X-C chemokine receptor type 5 | CXCR5 | Liao J, et al. (2020) 43 | Increased | ||
Validation of H2O2 induction
The optimal concentration and time point of H2O2 to induce PBMC cell death was initially defined for further evaluation of its effect on SLE patients’ sera. The data showed that the degree of cell death was increased by approximately 50% in PMBCs treated with all concentrations (0.2, 1, and 5 mM) of H2O2 for 24 and 48 hours, and cell death was also markedly increased in a dose-dependent manner compared with those without the treatment that served as controls in this study (p < 0.05) (Figure 1 A and B). In addition, all concentrations of H2O2 markedly decreased the number of cells after 24-hour treatment when compared with the control (p < 0.05) (Figure 1 A and C). Interestingly, the minimum concentration of H2O2 used in our study (0.2 mM) was able to increase cell death and decrease the total number of PBMCs following 24 hours of treatment, which was suggested as the long induction period (Figure 1). Therefore, 0.2 mM of H2O2 was used as the optimal concentration needed to efficiently induce PBMC cell death in the long treatment period (24 hours) for all subsequent experiments.
Effect of SLE patients’ sera on cell death
Using the optimal concentration and induction time point of H2O2, the effects of SLE patients’ and healthy individuals’ sera on PBMC death were investigated. Following 24 hours of treatment, cell death was significantly enhanced in PBMCs treated with serum samples from SLE patients both with and without 0.2-mM H2O2 induction compared with those of healthy individuals and without H2O2 induction (control) (p < 0.05). Furthermore, the degree of cell death in PBMCs treated with SLE patient sera and H2O2 was markedly higher than in PBMCs with only H2O2 induction (p < 0.05) (Figure 2 A and B). Meanwhile, total cell numbers of PBMCs treated with serum samples from SLE patients and healthy controls both with and without H2O2 were not significantly different compared to PBMCs treated with only H2O2 induction and the control (Figure 2 A and C).
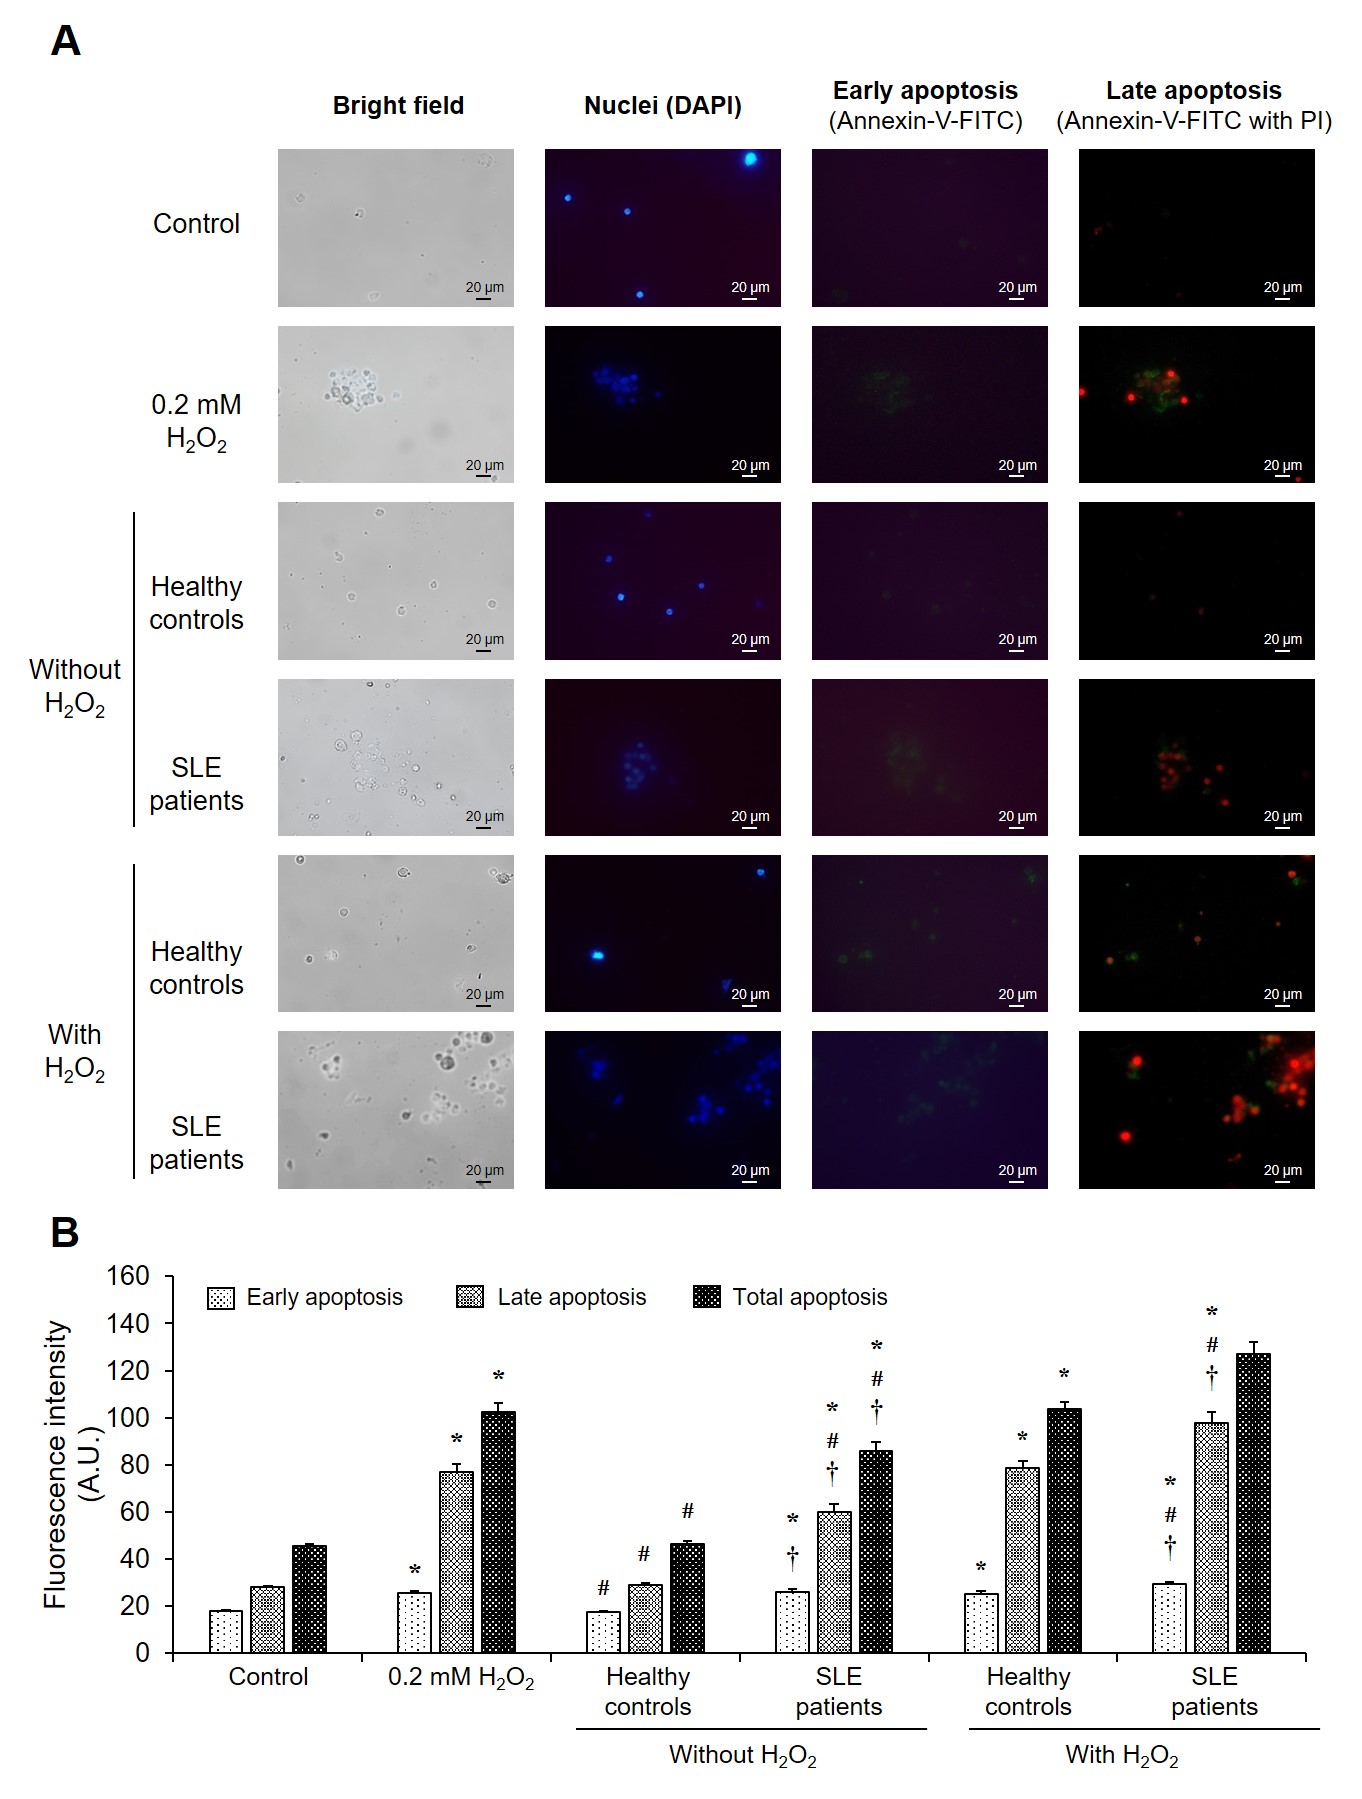
Effect of SLE patients’ sera on cellular apoptosis
To further determine whether SLE patients’ sera could induce cell death via an apoptotic process, the effect of serum samples from SLE patients compared with healthy controls in each phase and total PBMC apoptosis was investigated using the optimal concentration and induction time point of H2O2. Following 24 hours of treatment, the degree of total, early-, and late-phase cell apoptosis in PBMCs treated with SLE patients’ sera had significantly increased compared with that of healthy individuals and without H2O2 induction (control) (p < 0.05) (Figure 3). PBMCs treated with SLE patients’ sera with 0.2 mM H2O2 induction were observed to have elevated degrees of total, early-, and late-phase apoptosis compared with those of healthy individuals and H2O2 apoptosis inducer (p < 0.05) (Figure 3).
Systematic analysis of serum and plasma proteins related to cell apoptosis
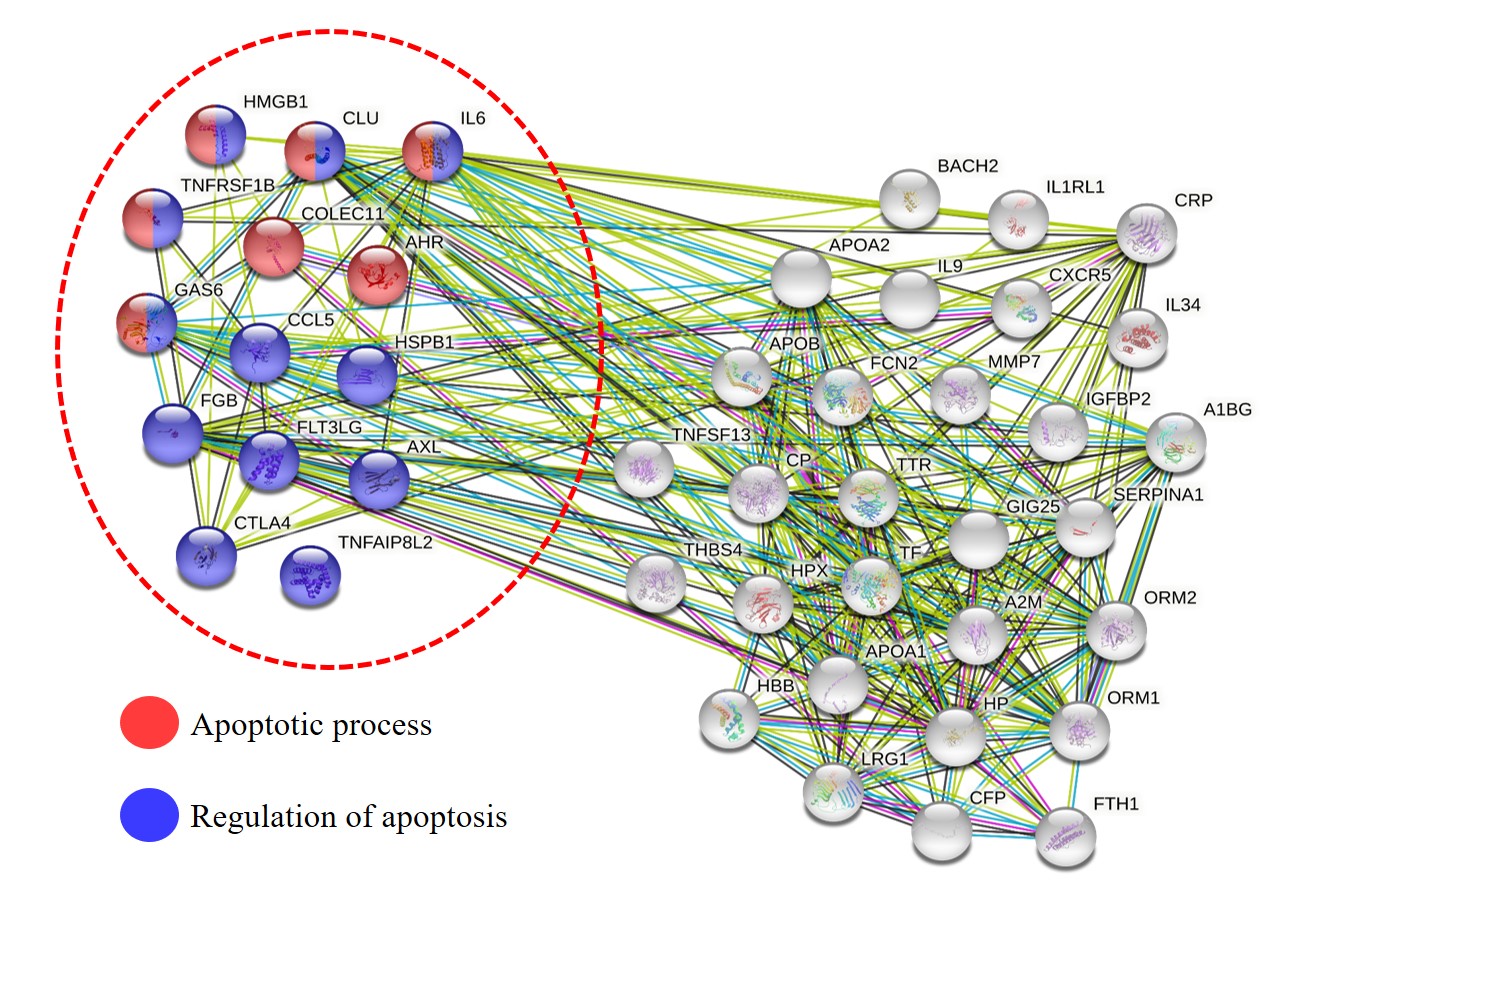
All the serum and plasma proteins that were altered in SLE patients were retrieved from the previous proteomics studies using literature cited in PubMed, MEDLINE, and ScienceDirect databases from 2005 to 2021. The data showed that 45 proteins collected in the serum or plasma of SLE patients were present in abnormal levels compared with healthy individuals; the levels of 32 proteins were increased and 13 proteins were reduced, as detailed in Table 2.
For biological analysis of apoptotic processes, all the collected sera and proteins were submitted to the STRING tool and the functional categories of these proteins were subsequently predicted by global network analysis relative to GO terms. The integrative proteome network created by STRING software reported that 14 altered proteins had biological roles involved in the apoptotic process (red node) or regulation of apoptosis (blue node), which consisted of high mobility group box chromosomal protein 1 (HMGB1), RANTES (regulated upon activation, normal T cell expressed and secreted) (CCL5), growth arrest-specific 6 (Gas6), tyrosine protein-kinase receptor UFO (Axl), tumor necrosis factor receptor 2 (TNFRSF1B), interleukin 6 (IL-6), collectin 11 (COLEC11), aryl hydrocarbon receptor (AhR), tumor necrosis factor α-induced protein 8-like 2 (TNFAIP8L2), heat-shock protein beta 1 (heat shock protein 27, HSPB1), clusterin (CLU), fibrinogen beta chain (FGB), Fms-related receptor tyrosine kinase 3 ligand (FLT3LG), and cytotoxic T lymphocyte-associated protein 4 (CTLA4) (Figure 4).
Confirmation of increased IL-6 levels in the sera of SLE patients
The level of IL-6 in the sera of SLE patients was determined and compared to healthy controls via ELISA assay with capture and detection antibodies specific to human IL-6. The results revealed increased levels of IL-6 (142.54 ± 25.41 pg/ml) in the sera of SLE patients compared with healthy controls (21.87 ± 1.61 pg/ml) (p < 0.05) (Figure 5).
Discussion
Apoptosis is a critical process in the pathogenesis, severity, and development of several diseases, especially the autoimmune disease SLE. Apoptosis occurs normally in the human body to maintain homeostasis via the elimination of dysfunctional or abnormal cells8. The levels of this process are stimulated by environmental factors, including ROS, such as H2O2, which is also involved in the progression of disease severity. Previous results demonstrated that H2O2 was able to induce the apoptosis of lymphocytes in SLE patients through oxidative stress mediated by the depletion of intracellular glutathione; this apoptotic acceleration also correlated with the severity of the disease, which is represented by the SLE disease activity index (SLEDAI) score14, 15. Therefore, we applied H2O2 as an inducer of apoptosis in mononuclear cells in our present study. The concentration and incubating time point of H2O2 was optimized for the induction of apoptosis in mononuclear cells. Our results demonstrated that 0.2 mM H2O2 could increase the apoptosis of mononuclear cells by approximately 50% after incubation for 24 hours (Figure 1 ), which was consistent with a previous study establishing that exposure of human lymphocytes to low concentrations of H2O2 (less than 1 mM) could influence apoptosis in these cells16.
H2O2 is a type of ROS that is recognized as a potent agent for inducing oxidative stress-mediated apoptosis. H2O2 can initiate apoptosis through caspase-dependent and -independent (apoptosis-inducing factor; AIF) pathways. Exposing cells to H2O2 resulted in changes to the mitochondria involved in apoptotic triggers, including the potential loss of mitochondrial membranes to release cytochrome c, subsequent caspase activation, AIF translocation into the nucleus, initiation of DNA condensation, damage, and finally, apoptosis17, 18. Recently, lymphocytes were demonstrated to be sensitive to ROS, which cause apoptosis because the plasma membranes of lymphocytes are mainly composed of polyunsaturated fatty acids, which are susceptible to oxidization by lipid peroxidation19, 20. Moreover, H2O2 can diminish the phagocytic capacity of macrophages, which is related to the role of the immune response in the pathogenesis and severity of SLE15. Therefore, H2O2 was chosen to trigger PBMC death via the apoptotic process in this study, and the results showed efficient induction of H2O2 treatment (Figure 1, Figure 2, Figure 3). This success was possibly due to the susceptibility of polyunsaturated fatty acids in the cell membranes and initiation of the apoptotic process in these cells.
SLE serum has been reported to have the capacity to stimulate the apoptosis of immune cells, which subsequently increases the levels of nuclear self-antigens and the disease activity of patients. It is possible that soluble components in the sera of SLE patients serve as inducers for the development of disease severity. In this study, we first confirmed the ability of SLE patients’ sera to increase early- and late-phase cell apoptosis in PBMCs with and without H2O2 induction (Figure 3). The demographics of the SLE patients and healthy individuals from whom sera were collected for treatment were not significantly different (Table 1). The results revealed that apoptosis was induced in healthy circulating mononuclear cells by the components of the SLE patients’ sera; this process occurred via the externalization of plasma membrane phosphatidylserine, allowing annexin-V to bind (early apoptosis) and lose membrane integrity, and allowing PI to pass through and intercalate into nucleic acids (late apoptosis)21. The data were consistent with a previous study that demonstrated that SLE serum was able to alter the morphology of cells involved in classical apoptosis via the death receptor-independent pathway13. Moreover, apoptotic induction has not been observed in the sera of patients of other autoimmune diseases, such as rheumatoid arthritis, systemic vasculitis, or infectious diseases, which implies the specific capacity of SLE serum to induce cell apoptosis. Furthermore, lupus autoantigens, which are related to SLE pathogenesis and severity, have been found in high concentrations on the blebbing surface of apoptotic cells12.
The main component found in the SLE sera was a protein that was intimately associated with apoptotic induction and pathogenesis in several diseases, including SLE. Abnormal levels of various proteins have been detected using proteomics studies in the sera and plasma of SLE patients, especially in the active stage of the disease. The levels of these proteins in SLE sera and plasma were found to be altered compared with the sera and plasma of healthy individuals. In this study, we collected several serum and plasma proteins in SLE patients that showed abnormal levels in nearly all of the previous proteomics reports between 2014 and 2020. Data from 12 published articles22, 23, 24, 25, 26, 27, 28, 29, 30, 31, 32, 33, 34, 35, 36, 37, 38, 39, 40, 41, 42, 43 indicated that the serum and plasma of SLE patients had 32 and 13 candidate proteins, respectively, which were found in increased levels compared with healthy controls (Table 2 ). In addition, 14 of these serum or plasma proteins had an intimate relationship with the apoptotic process and regulation of apoptosis. The altered proteins in SLE serum and plasma that were associated with both the apoptotic process and the regulation of apoptosis included HMGB1, TNFRSF1B, IL-6, and clusterin. The remaining 14 serum/plasma proteins were only associated with either the apoptotic process or regulation of apoptosis (Figure 4 and Table 2 ). It is possible that these 14 altered proteins could influence the apoptosis of circulating cells and the production of lupus autoantigens involved in disease severity, which should be further investigated. From the list of candidate proteins in Figure 4, IL-6 was indicated as one of the altered serum proteins that was intimately involved in the apoptotic process and regulation of apoptosis. It is thus possible that IL-6 in the sera of SLE patients has the ability to induce circulating mononuclear cell death and apoptosis, which is the process for development of SLE severity. Dysregulation of IL-6 has been associated with disease severity in the active stage in SLE patients44. The present study validated the increased levels of serum IL-6 in SLE patients and the results confirmed that the sera of SLE patients had higher levels of IL-6 than healthy controls, suggesting that IL-6 might serve as an important serum molecule for inducing cell death and apoptosis in patients. However, our study had a small sample size of SLE patients for investigating the effect of patients’ sera on the induction of mononuclear cell apoptosis compared with healthy individuals. Therefore, studies with larger numbers of SLE patients and healthy individuals are needed to make meaningful conclusions regarding this effect.
Conclusions
The data from the present study demonstrated that molecules in serum samples from SLE patients were able to increase cell death through the early and late stages of the apoptotic process in mononuclear cells, including lymphocytes and monocytes, both with and without chemical induction of apoptosis using H2O2. The systematic exploration of altered molecules in SLE serum or plasma using previous proteomic data revealed that 14 proteins were present in abnormal levels in SLE patients compared with healthy individuals. An intimate association with the apoptotic process or regulation of apoptosis, established by bioinformatics analysis, was observed for HMGB1, RANTES, Gas6, Axl, TNFRSF1B, IL-6, collectin-11, AhR, TNFAIP8L2, HSPB1, clusterin, FGB, FLT3LG, and CTLA4. These serum and plasma proteins from SLE patients might serve as candidate factors for the induction of cell apoptosis related to the pathogenic mechanism and severity of SLE.
Abbreviations
ACR: American College of Rheumatology; AhR: Aryl hydrocarbon receptor; AIF: Apoptosis-inducing factor; ANOVA: One-way analysis of variance; Axl: Tyrosine-protine kinase receptor UFO; CCL5: RANTES (regulated upon activation, normal T cell expressed and secreted); CLU: Clusterin; COLEC11: Collectin-11; CTLA4: Cytotoxic T-lymphocyte-associated protein 4; DNA: Deoxyribonucleic acid; ELISA: enzyme-linked immunosorbent assay; EULAR: European League Against Rheumatism; FGB: Fibrinogen beta chain; FLT3LG: Fms related receptor tyrosine kinase 3 ligand; Gas6: Growth arrest-specific 6; GO: Gene ontology; H2O2: Hydrogen peroxide; HMGB1: High mobility group box chromosomal protein 1; HSPB1: Heat shock protein beta-1 (heat shock protein 27); IL-6: Interleukin-6; PBMC: Peripheral blood mononuclear cell; PI: Propidium iodide; PS: Phosphatidylserine; RBC: Red blood cell; ROS: Reactive oxygen species; SDS-PAGE: Sodium Dodecyl Sulfate polyacrylamide gel electrophoresis; SLE: Systemic lupus erythematosus; SLEDAI: Systemic lupus erythematosus disease activity index; STRING: Search Tool for the Retrieval of Interacting Gene/Proteins TNFAIP8L2: Tumor necrosis factor-α-induced protein-8 like-2 TNFRSF1B: Tumor necrosis factor receptor 2; UPHEC: University of Phayao Human Ethics Committee
Acknowledgments
The authors recognize and thank all of the study participants, including the systemic lupus erythematosus patients and healthy individuals. The authors also appreciate the School of Allied Health Sciences, University of Phayao, Thailand, for providing the necessary laboratory equipment and facilities.
Author’s contributions
SK designed research; All authors (SK, KS, and NP) performed experiments and analyzed data; SK wrote and approved the manuscript. All authors read and approved the final manuscript.
Funding
Research grants from the School of Allied Health Sciences, University of Phayao (Project number: AHS-RD-63001) and the Fundamental fund from University of Phayao (Project number: FF65-RIM137).
Availability of data and materials
Data and materials used and/or analyzed during the current study are available from the corresponding author on reasonable request.
Ethics approval and consent to participate
The authors are accountable for all aspects of the work in ensuring that questions related to the accuracy or integrity of any part of the work are appropriately investigated and resolved. All the SLE patients and healthy control subjects provided written informed consent to participate in the present study and the research ethics were approved by the University of Phayao Human Ethics Committee, Thailand (UPHEC; approval no. 2/143/62) in accordance with international guidelines, including the Declaration of Helsinki, the Belmont Report, and ICH Good Clinical Practice.
Consent for publication
Not applicable.
Competing interests
The authors declare that they have no competing interests.
References
-
Rees
F.,
Doherty
M.,
Grainge
M.J.,
Lanyon
P.,
Zhang
W.,
The worldwide incidence and prevalence of systemic lupus erythematosus: a systematic review of epidemiological studies. Rheumatology (Oxford, England).
2017;
56
(11)
:
1945-61
.
View Article Google Scholar -
Jakes
R.W.,
Bae
S.C.,
Louthrenoo
W.,
Mok
C.C.,
Navarra
S.V.,
Kwon
N.,
Systematic review of the epidemiology of systemic lupus erythematosus in the Asia-Pacific region: prevalence, incidence, clinical features, and mortality. Arthritis Care {&}amp; Research (Hoboken).
2012;
64
(2)
:
159-68
.
View Article Google Scholar -
Robson
M.G.,
Walport
M.J.,
Pathogenesis of systemic lupus erythematosus (SLE). Clinical and Experimental Allergy.
2001;
31
(5)
:
678-85
.
View Article Google Scholar -
Mok
C.C.,
Lau
C.S.,
Pathogenesis of systemic lupus erythematosus. Journal of Clinical Pathology.
2003;
56
(7)
:
481-90
.
View Article Google Scholar -
Munoz
L.E.,
van Bavel
C.,
Franz
S.,
Berden
J.,
Herrmann
M.,
van der Vlag
J.,
Apoptosis in the pathogenesis of systemic lupus erythematosus. Lupus.
2008;
17
(5)
:
371-5
.
View Article Google Scholar -
Bijl
M.,
Limburg
P.C.,
Kallenberg
C.G.,
New insights into the pathogenesis of systemic lupus erythematosus (SLE): the role of apoptosis. The Netherlands Journal of Medicine.
2001;
59
(2)
:
66-75
.
View Article Google Scholar -
Li
J.,
Yuan
J.,
Caspases in apoptosis and beyond. Oncogene.
2008;
27
(48)
:
6194-206
.
View Article Google Scholar -
Favaloro
B.,
Allocati
N.,
Graziano
V.,
Di Ilio
C.,
De Laurenzi
V.,
Role of apoptosis in disease. Aging (Albany NY).
2012;
4
(5)
:
330-49
.
View Article Google Scholar -
Dhir
V.,
Singh
A.P.,
Aggarwal
A.,
Naik
S.,
Misra
R.,
Increased T-lymphocyte apoptosis in lupus correlates with disease activity and may be responsible for reduced T-cell frequency: a cross-sectional and longitudinal study. Lupus.
2009;
18
(9)
:
785-91
.
View Article Google Scholar -
Rastin
M.,
Mahmoudi
M.,
Hatef
M.,
Sahebari
M.,
Tabasi
N.,
Haghmorad
D.,
T lymphocyte apoptosis in systemic lupus erythematosus patients. Iranian Journal of Basic Medical Sciences..
2013;
16
(8)
:
936-41
.
-
Jin
O.,
Sun
L.Y.,
Zhou
K.X.,
Zhang
X.S.,
Feng
X.B.,
Mok
M.Y.,
Lymphocyte apoptosis and macrophage function: correlation with disease activity in systemic lupus erythematosus. Clinical Rheumatology.
2005;
24
(2)
:
107-10
.
View Article Google Scholar -
Bengtsson
A.A.,
Sturfelt
G.,
Gullstrand
B.,
Truedsson
L.,
Induction of apoptosis in monocytes and lymphocytes by serum from patients with systemic lupus erythematosus - an additional mechanism to increased autoantigen load?. Clinical and Experimental Immunology.
2004;
135
(3)
:
535-43
.
View Article Google Scholar -
Bengtsson
A.A.,
Gullstrand
B.,
Truedsson
L.,
Sturfelt
G.,
SLE serum induces classical caspase-dependent apoptosis independent of death receptors. Clinical Immunology (Orlando, Fla.).
2008;
126
(1)
:
57-66
.
View Article Google Scholar -
Shah
D.,
Aggarwal
A.,
Bhatnagar
A.,
Kiran
R.,
Wanchu
A.,
Association between T lymphocyte sub-sets apoptosis and peripheral blood mononuclear cells oxidative stress in systemic lupus erythematosus. Free Radical Research.
2011;
45
(5)
:
559-67
.
View Article Google Scholar -
Pravda
J.,
Systemic Lupus Erythematosus: Pathogenesis at the Functional Limit of Redox Homeostasis. Oxidative Medicine and Cellular Longevity.
2019;
2019
:
1651724
.
View Article Google Scholar -
Antunes
F.,
Cadenas
E.,
Cellular titration of apoptosis with steady state concentrations of H(2)O(2): submicromolar levels of H(2)O(2) induce apoptosis through Fenton chemistry independent of the cellular thiol state. Free Radical Biology {&}amp; Medicine.
2001;
30
(9)
:
1008-18
.
View Article Google Scholar -
Son
Y.O.,
Jang
Y.S.,
Heo
J.S.,
Chung
W.T.,
Choi
K.C.,
Lee
J.C.,
Apoptosis-inducing factor plays a critical role in caspase-independent, pyknotic cell death in hydrogen peroxide-exposed cells. Apoptosis.
2009;
14
(6)
:
796-808
.
View Article Google Scholar -
Cheng
Y.C.,
Chen
P.Y.,
Way
T.D.,
Cheng
C.L.,
Huang
Y.P.,
Hsia
T.C.,
Pre-Treatment of Pterostilbene Enhances H2O2-induced Cell Apoptosis Through Caspase-dependent Pathway in Human Keratinocyte Cells. In Vivo (Athens, Greece).
2021;
35
(2)
:
833-43
.
View Article Google Scholar -
Sweeney
B.,
Puri
P.,
Reen
D.J.,
Modulation of immune cell function by polyunsaturated fatty acids. Pediatric Surgery International.
2005;
21
(5)
:
335-40
.
View Article Google Scholar -
Switzer
K.C.,
McMurray
D.N.,
Morris
J.S.,
Chapkin
R.S.,
(n-3) Polyunsaturated fatty acids promote activation-induced cell death in murine T lymphocytes. The Journal of Nutrition.
2003;
133
(2)
:
496-503
.
View Article Google Scholar -
Rieger
A.M.,
Nelson
K.L.,
Konowalchuk
J.D.,
Barreda
D.R.,
Modified annexin V/propidium iodide apoptosis assay for accurate assessment of cell death. Journal of Visualized Experiments.
2011;
:
2597
.
View Article Google Scholar -
Koyama
T.,
Tsukamoto
H.,
Miyagi
Y.,
Himeji
D.,
Otsuka
J.,
Miyagawa
H.,
Raised serum APRIL levels in patients with systemic lupus erythematosus. Annals of the Rheumatic Diseases.
2005;
64
(7)
:
1065-7
.
View Article Google Scholar -
Li
D.,
Song
L.,
Fan
Y.,
Li
X.,
Li
Y.,
Chen
J.,
Down-regulation of TIPE2 mRNA expression in peripheral blood mononuclear cells from patients with systemic lupus erythematosus. Clinical Immunology (Orlando, Fla.).
2009;
133
(3)
:
422-7
.
View Article Google Scholar -
Li
J.,
Xie
H.,
Wen
T.,
Liu
H.,
Zhu
W.,
Chen
X.,
Expression of high mobility group box chromosomal protein 1 and its modulating effects on downstream cytokines in systemic lupus erythematosus. The Journal of Rheumatology.
2010;
37
(4)
:
766-75
.
View Article Google Scholar -
Yang
Z.,
Liang
Y.,
Xi
W.,
Li
C.,
Zhong
R.,
Association of increased serum IL-33 levels with clinical and laboratory characteristics of systemic lupus erythematosus in Chinese population. Clinical and Experimental Medicine.
2011;
11
(2)
:
75-80
.
View Article Google Scholar -
Lu
M.M.,
Wang
J.,
Pan
H.F.,
Chen
G.M.,
Li
J.,
Cen
H.,
Increased serum RANTES in patients with systemic lupus erythematosus. Rheumatology International.
2012;
32
(5)
:
1231-3
.
View Article Google Scholar -
Watanabe
H.,
Saito
R.,
Asano
T.,
Sato
S.,
Iwadate
H.,
Kobayashi
H.,
Serum L-ficolin levels in patients with systemic lupus erythematosus. Modern Rheumatology.
2012;
22
(6)
:
899-902
.
View Article Google Scholar -
Ouyang
H.,
Shi
Y.,
Liu
Z.,
Feng
S.,
Li
L.,
Su
N.,
Increased interleukin 9 and CD4+IL-9+ T cells in patients with systemic lupus erythematosus. Molecular Medicine Reports.
2013;
7
(3)
:
1031-7
.
View Article Google Scholar -
Ye
L.,
Ji
L.,
Wen
Z.,
Zhou
Y.,
Hu
D.,
Li
Y.,
IL-37 inhibits the production of inflammatory cytokines in peripheral blood mononuclear cells of patients with systemic lupus erythematosus: its correlation with disease activity. Journal of Translational Medicine.
2014;
12
(1)
:
69
.
View Article Google Scholar -
Bakr
S.I.,
El Fedawy
S.F.,
Abbas
A.A.,
Shedid
N.H.,
Ahmed
S.F.,
Serum growth arrest specific protein 6 and its receptor (Axl) in SLE patients. The Egyptian Rheumatologist.
2015;
37
(2)
:
61-6
.
View Article Google Scholar -
Rai
R.,
Chauhan
S.K.,
Singh
V.V.,
Rai
M.,
Rai
G.,
Heat shock protein 27 and its regulatory molecules express differentially in SLE patients with distinct autoantibody profiles. Immunology Letters.
2015;
164
(1)
:
25-32
.
View Article Google Scholar -
Duan
J.H.,
Jiang
Y.,
Mu
H.,
Tang
Z.Q.,
Expression of BAFF and BR3 in patients with systemic lupus erythematosus. Brazilian Journal of Medical and Biological Research.
2016;
49
(3)
.
View Article Google Scholar -
Mok
C.C.,
Ding
H.H.,
Kharboutli
M.,
Mohan
C.,
Axl, ferritin, insulin-like growth factor binding protein 2, and tumor necrosis factor receptor type ii as biomarkers in systemic lupus erythematosus. Arthritis Care {&}amp; Research (Hoboken).
2016;
68
(9)
:
1303-9
.
View Article Google Scholar -
Umare
V.,
Nadkarni
A.,
Nadkar
M.,
Rajadhyksha
A.,
Khadilkar
P.,
Ghosh
K.,
Do high sensitivity C-reactive protein and serum interleukin-6 levels correlate with disease activity in systemic lupus erythematosuspatients?. Journal of Postgraduate Medicine.
2017;
63
(2)
:
92-5
.
View Article Google Scholar -
Zhong
L.,
Liu
J.,
Zhou
J.,
Sun
L.,
Li
C.,
Li
X.,
Serum proteomics study reveals candidate biomarkers for systemic lupus erythematosus. International Journal of Clinical and Experimental Pathology.
2017;
10
(10)
:
10681-94
.
-
Vira
H.,
Pradhan
V.,
Umare
V.,
Chaudhary
A.,
Rajadhyksha
A.,
Nadkar
M.,
Role of MMP-7 in the pathogenesis of systemic lupus erythematosus (SLE). Lupus.
2017;
26
(9)
:
937-43
.
View Article Google Scholar -
Ahn
S.S.,
Park
Y.,
Jung
S.M.,
Song
J.J.,
Park
Y.B.,
Lee
S.W.,
Serum leucine-rich α2-glycoprotein is elevated in patients with systemic lupus erythematosus and correlates with disease activity. Clinica Chimica Acta.
2018;
486
:
253-8
.
View Article Google Scholar -
Zhu
Z.,
Yang
C.,
Wen
L.,
Liu
L.,
Zuo
X.,
Zhou
F.,
Bach2 regulates aberrant activation of B cell in systemic lupus erythematosus and can be negatively regulated by BCR-ABL/PI3K. Experimental Cell Research.
2018;
365
(1)
:
138-44
.
View Article Google Scholar -
Madda
R.,
Lin
S.C.,
Sun
W.H.,
Huang
S.L.,
Plasma proteomic analysis of systemic lupus erythematosus patients using liquid chromatography/tandem mass spectrometry with label-free quantification. PeerJ.
2018;
6
:
e4730
.
View Article Google Scholar -
Yu
H.,
Jiang
L.,
Liu
R.,
Yang
A.,
Yang
X.,
Wang
L.,
Association between the ratio of aryl hydrocarbon receptor (AhR) in Th17 cells to AhR in Treg cells and SLE skin lesions. International Immunopharmacology.
2019;
69
:
257-62
.
View Article Google Scholar -
Yuan
X.,
Qin
X.,
Wang
D.,
Zhang
Z.,
Tang
X.,
Gao
X.,
Mesenchymal stem cell therapy induces FLT3L and CD1c+ dendritic cells in systemic lupus erythematosus patients. Nature Communications.
2019;
10
(1)
:
2498
.
View Article Google Scholar -
Zhao
L.,
Zhou
X.,
Zhou
X.,
Wang
H.,
Gu
L.,
Ke
Y.,
Low expressions of PD-L1 and CTLA-4 by induced CD4+CD25+ Foxp3+ Tregs in patients with SLE and their correlation with the disease activity. Cytokine.
2020;
133
:
155119
.
View Article Google Scholar -
Liao
J.,
Luo
S.,
Yang
M.,
Lu
Q.,
Overexpression of CXCR5 in CD4+ T cells of SLE patients caused by excessive SETD3. Clinical Immunology (Orlando, Fla.).
2020;
214
:
108406
.
View Article Google Scholar -
Ding
J.,
Su
S.,
You
T.,
Xia
T.,
Lin
X.,
Chen
Z.,
Serum interleukin-6 level is correlated with the disease activity of systemic lupus erythematosus: a meta-analysis. Clinics (Sao Paulo).
2020;
75
:
e1801
.
View Article Google Scholar
Comments
Article Details
Volume & Issue : Vol 9 No 4 (2022)
Page No.: 5007-5022
Published on: 2022-04-30
Citations
Copyrights & License
This work is licensed under a Creative Commons Attribution 4.0 International License.
Search Panel
Pubmed
Google Scholar
Pubmed
Google Scholar
Pubmed
Search for this article in:
Google Scholar
Researchgate
- HTML viewed - 3887 times
- PDF downloaded - 1302 times
- XML downloaded - 0 times
