

Copyrights: Josephine Selle J, Amilia Aminuddin, Kalaivani Chellappan, 2022. License: This work is licensed under a Creative Commons Attribution 4.0 International License.
Abstract
Introduction: Foot thermograms depict vascular distribution among foot regions with a spectrum of thermal values. Infrared thermography (IRT) is used to explore challenges in diagnosing complications that involve temperature differences.
Problem Statement: It is crucial to identify underlying diabetic ulcers in the foot plantar regions, which are typically missed in photographic images. Early detection of ulcer onset can reduce healing time and treatment costs; thus, IRT plays a vital role in identifying early-stage ulcers by detecting vascular changes. This systematic review aimed to identify studies of thermography in foot ulcer diagnosis, including analysis techniques, extracted features, and scores among patients.
Method: A literature search was conducted in PubMed and Scopus databases to identify relevant articles published within the last 10 years. The main criteria for the search results were articles in English with abstracts, and full articles that examine the relationship between diabetes mellitus (DM), foot ulcer and thermography among DM patients.
Results: The search identified 2,215 articles, with only 8 studies meeting the inclusion criteria. Foot thermograms were used to identify foot ulcer regions associated with temperature differences. The studies included parameters such as ankle brachial index (ABI), toe brachial index (TBI), age, sex, duration of diabetes, and type of diabetes for statistical analyses to verify the validity of temperature difference data in asymmetrical analysis.
Conclusion: Further interventional studies should be conducted to investigate foot IRT in patients with DM, as a variation in temperature differences may challenge the validity of foot thermograms in foot ulcer grading.
Introduction
According to the International Diabetes Federation (IDF), 463 million people, aged 20–79 years had diabetes in 2019, and this number is expected to increase to 578 million by 2030 and to 700 million by 2045 (Figure 1)1. Among the total mentioned above, nearly 80% of individuals with diabetes live in low- or middle-income countries. Global data for 2019 showed 4.2 million deaths due to diabetes mellitus (DM). In Southeast Asia, 1 in 2 adults have undiagnosed diabetes. Among all Asian countries, India has the highest incidence and mortality rates of DM in individuals aged 20–79 years. The alarming global rise in the death rate for diabetes may be due in part to high healthcare expenditures when diagnosis occurs at a later stage of disease2. A non-invasive early diagnostic tool embedded with a data-driven analysis approach is expected to be a future solution for early detection and diabetes management. Peripheral arterial disease (PAD) may occur due to smoking, diabetes, hypertension, and nerve damage3. In this systematic review, PAD will be discussed in its relation to diabetes; however, it is beyond the scope of our work to include all complications that occur with PAD.
Hence, this systematic review will focus on conditions associated with type 2 diabetes in the general population in India, in which the incidence rate is high. DM is a group of metabolic disorders that is characterized by high glucose levels in the blood. The regulation of blood glucose levels is essential to avoid the development of pathological conditions caused by either hyperglycemia or hypoglycemia. Hyperglycemia is a condition in which blood glucose levels are elevated, leading to a non-enzymatic glycation stage, which causes functional and structural disruptions to blood vessels. These anomalies affect major organs through micro and macrovascular complications which include peripheral neuropathies, poor wound healing or chronic neuropathy, coronary artery disease, cerebral vascular disease, and chronic kidney disease2. Among these, diabetic neuropathy is a major concern, in which the nerve fibers of the lower limbs of the body can become damaged by persistently high blood glucose levels4. Most diabetic foot ulcers are due to both ischemic and neuropathic conditions and are associated with pain and numbness in the extremities, as well as complications that include bacterial infection and deep-tissue destruction5, 6, 7. Figure 2 shows various complications that occur in the diabetic foot. This type of ulceration may lead to amputation of the foot due to chronic wounds that fail to heal6. Current practice for foot care in DM includes a complete history and physical examination, in addition to assessment by an expert and the time needed for a proper evaluation8, 9, 10, 11.


A simpler method to identify ischemic or neuropathic changes in the diabetic foot could facilitate diagnosis in a timely manner to avoid amputation of the foot. Because ischemia and neuropathy affect temperature regulation of the foot, temperature is an established clinical marker for diabetic neuropathy. Hence, the assessment of subtle changes in the thermal pattern of the foot may help identify pathologic conditions at an early stage and thus drastically decrease patients’ morbidity8. The human body typically regulates and maintains a normal body temperature within a narrow range, despite ambient temperature variations12. Thermal regulation in the body may vary, depending on neuropathic pathologies, inflammation, and peripheral arterial diseases. Studies have shown that diabetic foot ulcers are characterized by lower temperatures than those of the plantar foot13, 14, 15, 16, 17. However, these subtle changes in temperature cannot be felt by the examining physician during a manual examination of the foot. Hence, in recent years several studies have explored the use of infrared thermography (IRT) for measuring plantar foot temperature in the detection of diabetic foot ulcers18, 19, 20. The studies show that IRT has been extensively used to examine changes in lower limb temperature and to detect temperature changes during hyperglycemia. One of the major advantages of IRT is that the acquisition of an area under inspection provides maximum pixel elements in less time and with accurate temperature values. Recent technological advances in thermal cameras for improving speed and resolution have made it possible to adapt these techniques for medical use21, 22, 23. In diabetic foot analysis, patient preparation for the acquisition of plantar foot thermograms is carried out with the patient in a supine position and with bare feet. The patient is asked to rest for about 20 min to attain a temperature equilibrium before the thermal image is captured24, 25, 26. As thermography is useful for inspecting an ischemic foot and a neuropathic foot, a computer-aided tool that can assist clinicians in patient-specific diagnosis would be an important addition to current clinical practice. A grading technique is also required to characterize colder temperatures in ischemic cases and warmer temperatures in neuropathic cases4.
Methods
Eligibility Criteria
The main inclusion criteria for the search results were articles in English with abstracts, and full articles that discussed the relationship between DM, foot ulcer, and IRT among DM subjects. Studies that included animals or tissue cultures were excluded. In addition, review papers, letters, conference papers, articles in the press, editorials, and short surveys were excluded. For the present systematic review, only studies that showed the relationship between DM, foot ulcer, and IRT were selected. Articles were filtered in three stages before they were selected for inclusion in the review. In the first stage, any articles that did not meet the inclusion criteria were removed. In the second stage, filters were applied for the range of years between 2010 and 2020, and only full articles were screened. In the final stage, articles that contained the selection criteria keywords were included. All readers had to agree on the criteria of the selected articles to be reviewed before the data extraction stage. Any conflicts of opinion were resolved by rational discussion among the reviewers. All data searching was performed independently through data search engines. The following data were obtained from the articles and tabulated accordingly: year of publication, pre-processing type, segmentation technique, automated vs. manual region of extraction, and classifiers used. The search found twelve articles potentially related to the search criteria, of which eight articles met the inclusion criteria (Figure 3).

Information Sources
Extensive studies on the diabetic foot using thermography techniques for identifying and classifying the thermal variations in the plantar region have been carried out. The angiosomes were combined in a new classification matrix consisting of 20 types of thermal patterns27. The medial plantar artery (MPA) and lateral plantar artery (LPA) thermal patterns for 32 healthy subjects and 129 patients with diabetes without foot ulcers are represented in the rows, and the medial calcaneal artery (MCA) and lateral calcaneal artery (LCA) of the thermal patterns are represented in the columns. Statistical analysis revealed that temperature patterns differed significantly between healthy individuals and those with diabetes. Atypical patients were defined as those who did not fit into any of the 20 categories. This categorization scheme could be utilized in foot care and surgical interventions to identify vascular conditions.
Based on mean temperature variations between the ipsilateral and contralateral areas of the foot, an algorithm was used to categorize the types of ulcerations28. Five of the 15 patients had no complications, five had local complications (e.g., neuropathic ulcers), and the remaining five cases had diffuse complications, such as ischemic ulcers resembling Charcot’s foot. Cases with no complications showed a temperature difference of less than 1.5 °C, those with local complications had a temperature difference of less than 2 °C, and cases with diffuse complications had a temperature difference of less than 3 °C. Manual segmentation for border detection and lack of significance were two of the drawbacks identified in this paper.
The atypical cases described in another study27 were grouped into one of seven categories previously defined in a different study29. The authors used pre-processing and image segmentation to distinguish the plantar and distal regions for standardizing the temperature values. A method for grading the infection level was presented in another study30. The presence of erythema, foot ulcers, calluses, blisters, or fissures was used to grade the level of infection using the perfusion, extent, depth, infection and sensation (PEDIS) classification system. Infections were classified as hotspot, erythema, or foot ulcers based on a temperature differential greater than 2.2 °C. The research included 54 individuals with foot complications, such as infections, ulcers, and Charcot’s foot31. The classification was carried out by calculating the temperature differential between six pre-defined regions on the contralateral foot. The authors proposed further studies to categorize foot thermograms and treatment urgency.
The authors of another study32 proposed a method that employed image processing and morphological approaches to overcome the deformations produced by amputation. K means and EM clustering were used to distinguish between ambient and foot temperatures. Temperature differences were utilized as a significant factor in study33 to distinguish between DM patients, with and without complications. In comparison to patients with DM, without complications, PAD-affected DM patients showed temperatures greater than 26.2 °C. In one study with 43 subjects34 the PAD from 21 regions of interest were characterized. Features were extracted and classified using the support vector machine (SVM) model.
Various methods are available for detecting and grading foot ulcers and infections. All of these assessments, however, require manual examination of the soles of the patient’s feet, which are not typically visible under normal circumstances. Foot thermography, which is a non-invasive method for studying a patient’s feet, can be utilized to obtain thermograms of the thermal pattern of the foot, which enables early diagnosis and the grading of infections. The value of temperature differences as a key feature in image analysis to define infection in the foot is explained in the present review.
Search Strategy
A literature search was conducted to investigate the relationship between DM, foot ulcers, and classification of the ulcers using thermography in patients with DM. PubMed and Scopus databases were used to identify relevant articles published between 2010 and 2020. Related articles were identified by using two groups of keywords: (1) classification of foot ulcers using thermography AND (2) pre-processing techniques for the classification of foot ulcers OR image segmentation techniques for the classification of foot ulcers OR pre-processing techniques for the classification of foot ulcers.
Data Extraction
Data were extracted from all identified studies and followed a specified format. The following variables were included: year of publication, type of image analysis involved, classification techniques used, statistical analysis conducted, and features used in classification techniques and findings.
| No. | Methodology | Description | Steps | |
|---|---|---|---|---|
| Processing | Classification | |||
| 1 | -- | 20 types using Angiosome concept | Framework of 20 categories that is used to compare the acquired thermal patterns of healthy subjects and DM patients using MPA, LPA, MCA and LCA 27 | Image type & size : Plantar thermogram and digital images for atypical cases Device type : Thermotracer (TH5108ME, NEC) Clustering/Classification technique : Classification framework with 20 categories Grading/ MODELLING approach : Manual grading using thermographic patterns of the distal and heel regions. |
| 2 | Manual RoI annotations | Mean temperature differences in contralateral & ipsilateral foot | Manually segmented boundaries for IR and photographic images. Mean temperature difference compared with three threshold values 1.5o C and 2o C and 3o C. Grading of the ulcer types were done by using University of Texas wound classification method 28 | Image type & size : color image using and thermogram Device type : Cannon Eos with 40D and FLIR SC305 320 x 240 pixels Pre-processing technique : Manual annotation of the foot boundaries Grading /MODELLING approach : Manual classification based on thermal differences |
| 3 | Segmentation using image partitioning algorithm | Computer based 7 types categories | preprocessing done to standardize the temperature values for the same color. segmentation is done to partition the regions into clusters with same pixel values. Cases are then classified into either of the 7 types 29 | Image type & size : plantar thermograms Device type : Thermotracer (TH5108ME, NEC) Pre-processing technique : Color bar adjustment Grading /MODELLING approach : image segmentation using mode-seeking method using probability density function for clustering the common pixels |
| 4 | No pre-processing mentioned | 3 three types of foot infection assessment: live, photographic foot, infrared thermography | Using three techniques: live observation, PEDIS and temperature difference, the foot infection was classified 30 | Image type & size : photographic images and temperature values from surface Device type : photographic foot imaging device and Temptouch instrument Classification method : PEDIS score based |
| 5 | Boundary detection | Manual classification based on thermal differences into three groups 1. complications with immediate treatment, 2. complications with not immediate treatment, 3. no complications | Cut-off temperature to decide on the type of infection and urgency of treatment is > 2.2o C 31 | Image type & size : color & thermograms of the foot Device type : Canon & FLIR 320x240 pixels Pre-processing technique : manual annotation on boundaries of the foot in color image Classification approach : classified based on temperature difference |
| 6 | Automated segmentation | Asymmetric analysis | Three step process that involves segmentation of foot regions from the background using K means clustering and EM clustering, registration of thermal and color images using B splines and third using asymmetric analysis of temperature difference between right and left foot 32 | Image type & size : color & thermograms of the foot Device type : CanonEOS40D & FLIRSC305 320x240 pixels Pre-processing technique : automated segmentation of the foot using unsupervised machine learning algorithms Classification approach : Manual comparison of the contralateral foot. |
| 7 | Automated segmentation & extraction of foot regions manually | Classification using temperature values | Identification of DM with and without complications using temperature difference 33 | Image type & size : thermograms of the foot 320 x 240 pixels Device type : FLIR SC7200 Pre-processing technique : automated segmentation of the foot using region growing method Classification approach : using temperature differences and statistical analysis |
| 8 | Normalizations of thermograms | Support Vector Machine (SVM) | 12 features extracted that are used in the classification of PAD using 21 regions of interest from the foot 34 | Image type & size : thermograms of the foot 640 x 480 pixels Device type : Xenics Goby 640 GigE Pre-processing technique : normalization of images Classification approach : Classification using SVM machine learning model |
Results
Study Selection
As illustrated in Figure 3, our review identified 2,215 publications, of which 2,203 met the exclusion criteria. As a result, 12 papers published between 2010 and 2020 were included. Following a thorough review of the text, four papers were eliminated due to the lack of foot thermogram analysis. Overall, 8 scientific articles were analyzed, all of which contained image processing analysis of foot thermograms. The studies included were published between 2010 and 2020, as shown in Table 1, with one study carried out in 2020, one study in 2018, one study in 2015, two studies in 2014, two studies in 2013, and one study in 2011.
Analyses from the Results
Among the eight studies, six28, 29, 31, 32, 33, 34 described the use of image processing techniques to classify foot thermograms. The remaining two studies27, 30 demonstrated manual categorization using temperature difference measurements or statistical analysis. The findings in these studies demonstrate that image processing has a higher sensitivity and specificity rate in classifying foot thermograms compared to human observation, likely due to the fact that it is independent of human involvement and provides a more accurate clinical forecast. Five studies utilized statistical analysis, such as the t-test, chi-square, independent t-test, and Mann-Whitney U test for the asymmetry comparison between DM patients and control subjects27, 28.
Two studies31, 33 provided statistical analysis, as well as asymmetry analysis, of temperature readings with a difference greater than 2.65 °C between the right and left foot for diabetic individuals. Each group showed a statistically significant difference (p < 0.001). One study23 manually divided the regions of interest from foot thermograms and conducted a statistical analysis with a receiving operator characteristic (ROC) curve and area under the ROC curve to determine cut-off values for classifying the urgency of therapy for patients with peripheral neuropathy. A classification was performed between patients with DM and individuals with PAD due to DM in a different study33. The t-test and parametric test revealed significant variations in temperature between the two groups. Segmentation employing a region-growing algorithm was found to provide the region of interest (RoI) for properly estimating the temperature of the foot.
In addition to temperature data, age, duration of diabetes, type 2 diabetes, ankle brachial index (ABI), toe brachial index (TBI), sex, and energy of intensity values were also included in the analysis of the foot thermograms27, 29, 34. Table 1 provides a summary of the techniques used in the associated articles.
In general, temperature differences between the affected and contralateral foot thermograms are an essential characteristic that requires further investigation, whether asymmetrically or statistically. To successfully distinguish between non-diabetic individuals and patients with DM, classification with pattern classifiers such as the SVM model34 was carried out in addition to the asymmetric analysis of foot thermograms. Table 2 summarizes the findings of the eight papers included in the review.
| Ref. No. | Population study | Average Age | Complications | Type of analysis | Image Processing Techniques | |
|---|---|---|---|---|---|---|
| Asymmetrical analysis | Statistical Analysis | |||||
| 27 | N = 161 (129) Non-ulcer diabetic (32) Normal | (36.8) Normal (67.2) DM | Not mentioned | -- | T-test and chi square test | -- |
| 28 | N = 15 (5) Normal (5) DM with local complications (5) DM with diffuse complications | (67.6) - Normal (70.4) - DM | Ulcer hallux, callus, charcot foot, | Temperature difference and standard deviation values for control = -0.16 and DM = 1.79 | -- | Manual annotations for RoI extraction |
| 29 | N = 161 (129) non-ulcer diabetic (32) Normal | (36.8) Normal (67.2) DM | Not mentioned | -- | T-test and chi square test | Color adjustment and image-partitioning algorithm for segmentation |
| 30 | (38) DM 31- M, 7-F | Not mentioned | Erythema, hotspot with infection, ulcer | Temperature difference with 2.2 | -- | -- |
| 31 | N = 54 (20) normal (34) DM | (66) Control (64) DM | charcot, ulcer hallux | Temperature difference for control = 0.9, and DM = 3.1 | Cut-off values determined using ROC and area under ROC | Manual RoI, image partitioning |
| 32 | N = 76 (7) DM I (69) DM II | 66 | Blisters, callus, ulcerations, redness | Left & right foot non - rigid registration | -- | Color image segmentation using EM clustering and feet registration for vertical alignment |
| 33 | N = 84 (62) DM with PAD (22) DM without PAD | (68) DM with PAD (62.8) DM without PAD | PAD with peripheral neuropathy | Significant temperature difference between DM & DM + PAD | Normality and independent t test | Automated image segmentation using region growing algorithm |
| 34 | N = 43 (20) Normal (23) DM | (59) Control (64) DM | PAD with, 0.9 ABI | -- | U mann Whitney test | Image equalization, features extraction and classification using SVM |
Discussion
Temperature values are used as a key indicator of an underlying problem in a diabetic patient’s foot thermogram. Apart from the asymmetry analysis using temperature values, image processing techniques, including segmentation and pattern classifiers, were used to automatically categorize the thermograms without the need for human interpretation. We highlight a few noteworthy studies below.
Healthy individuals (n = 32) and diabetic patients with neuropathy (n = 129) were included in a study of the diagnostic utility of foot thermograms27. In order to compare the foot thermograms obtained, 20 types of thermal patterns were developed. According to the authors’ findings, 75% of patients in the control group and 87.2 % of patients with DM could be classified in the pre-defined thermal patterns. The following limitations were identified: bias observation when comparing the thermograms with the classification system; mean age and sex were not normalized between the control and DM groups; neuropathy causes instability in the plantar foot regions; and 20 categories resulted in a complicated analysis were not suitable for clinical use. The authors addressed these shortcomings in a follow-up study29 by including an image partitioning method for extracting the RoI and reducing the categories to six, which include only the distal area of the foot.
In another study28, a total of 15 patients with DM were enrolled. Patients with no complications had a temperature difference of less than 2 °C, patients with local complications, such as non-ischemic neuropathic ulcers and callus, had a temperature difference of more than 2 °C, and patients with diffuse complications, such as Charcot and osteomyelitis, had a temperature difference of more than 3 °C, according to asymmetric analysis. Furthermore, RoI extraction helped make the study possible. The thermogram were unable to exhibit symptoms of diffuse cases, which restricted the population for enrollment, according to this study’s findings.
Thermometry and thermography are two techniques for analyzing the temperature of the feet. Thermometry focuses on selected regions of the foot, whereas thermography looks at the entire area. In one study, thermography was used to monitor temperatures in six distinct locations in patients with DM (n = 36)30. Significant temperature variations were discovered between hotspots, erythema, and ulcers, according to the study.
In a different study, 76 patients with DM who presented with callus, blisters, redness, and ulcerations were included32. The RoI was segmented using machine learning methods, and the foot was aligned in the vertical position using non-rigid landmark-based registration. Although image processing techniques have advanced in terms of patient classification, there were certain limitations to this study. Because a comparison could only be made between both feet in patients with DM, the registration procedure would fail if only one foot was available, such as in cases of amputation.
Although a substantial amount of research has been done on temperature differences in diabetic patients, there have been relatively few studies on temperature differences in PAD-related problems of the foot using thermography35, 36. This might be due to the lack of feasibility of asymmetry analysis in this population, as PAD patients have lower vascular variations in their lower limbs, which could result in abnormalities being missed. One study34 included 23 patients with PAD, a 0.9 ABI, and an average age of 64 years, as well as 20 control subjects with an average age of 54.6 years. Energy intensity values were computed as features and supplied to SVM classifiers as inputs. Statistical analysis with the Mann-Whitney U test was performed to confirm the classification results. Interdigital zones were excluded because they include deformities in the foot, whereas toes and insteps showed increased vascularity improvements.
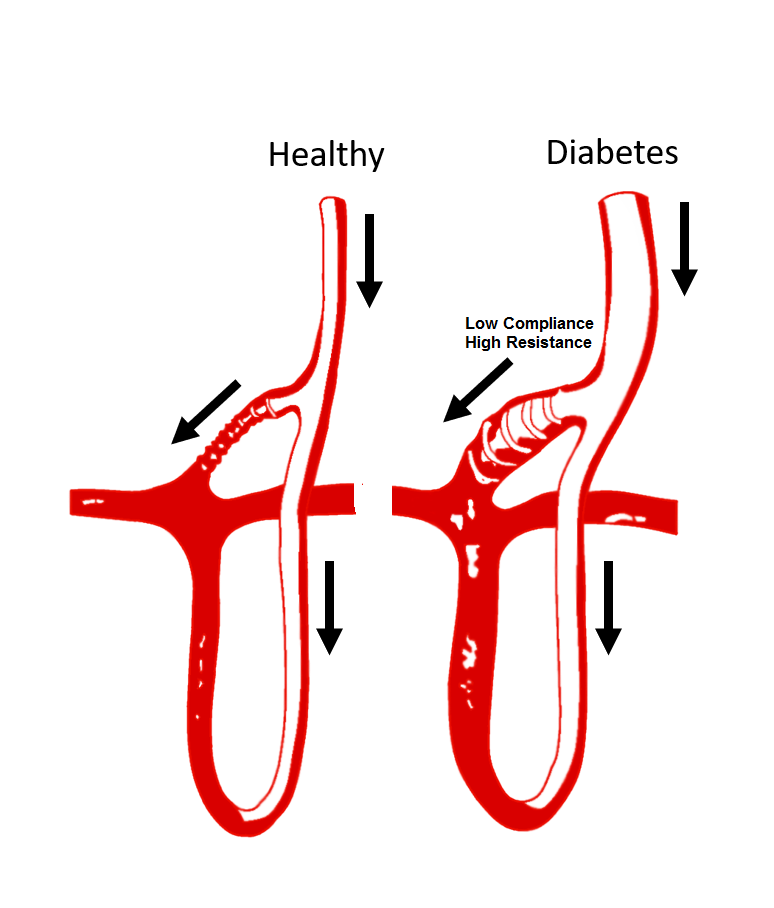
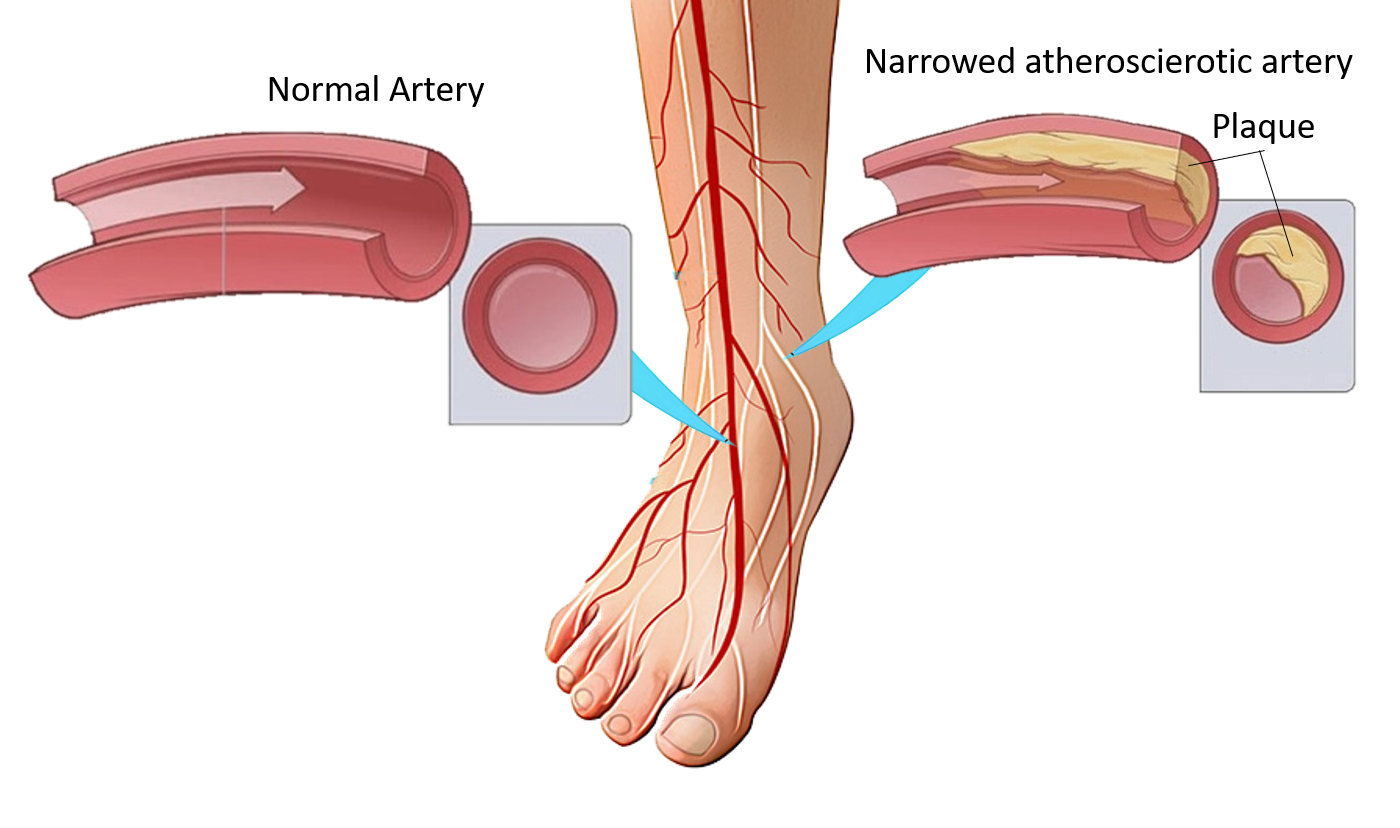
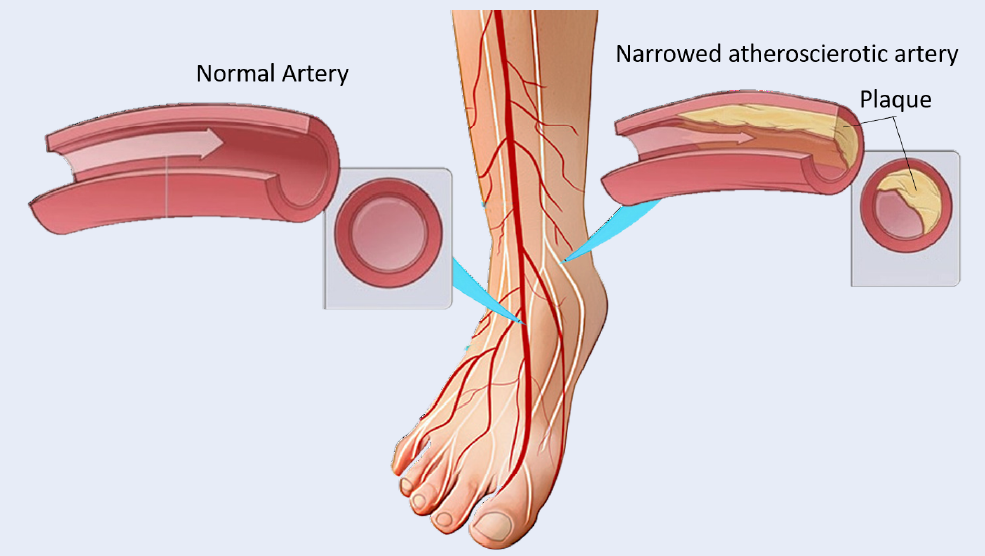
By using temperature as an essential marker for distinguishing foot ulcers in patients with DM, IRT includes a mode for measuring the temperature of ulcer-affected areas beneath the skin. Any rise in temperature on the plantar surface of the foot could be a symptom of pre-ulcer inflammation, necessitating further research and foot screening37, 38, 39. In diabetic individuals, this type of temperature fluctuation indicates a problem with thermoregulation. Neuropathic disease, ischemia, infection, or a combination of these might induce a rise in temperature. Arteriovenous shunting can occur due to autonomic neuropathy, resulting in a vasodilatory state in tiny arteries (arterioles)40, 41, 42. Increased cutaneous blood flow and aberrant inflammatory responses to tissue damage result in a significant hemodynamic disturbance. Shunting increases venous pressure, which reduces the arteriovenous pressure differentially across the nutritive capillaries. This effect causes tissue ischemia and decreases capillary blood flow43, 44, 45. Higher hemodynamics contribute significantly to massive basement thickening, which impairs capillary vessel wall flexibility and leads to poor nutrition exchange, further exacerbating diabetic foot ulceration38. Figure 4 illustrates a healthy foot vs. a diabetic foot that is susceptible to ulceration due to a disruption in the microcirculatory system. Because a fever could suggest infection, immediate treatment is required. According to a literature review, a temperature difference of > 3 °C between the affected and contralateral foot acts as a cut-off value to indicate that the patient requires immediate medical attention28. In addition, the authors of one of the included studies31 have proposed research that compares several cut-off diagnostic values for identifying diabetes-related foot problems, including ulceration, infection, and Charcot’s foot. PAD, a disorder in which fatty deposits restrict the arteries in the foot and decrease blood flow in the lower extremities, is also associated with a drop in temperature37, 38 (Figure 5). One of the erroneous clinical findings is that colder limbs are considered normal since they are less perfused. However, in the event of PAD-related problems in the DM foot, such cases should not be overlooked and require medical attention as soon as possible for additional thermographic evaluation33.
Although thermography is able to reveal differences in thermoregulation in patients with DM, digital processing of the thermograms is critical, as the human eye might overlook significant information. To appreciate the urgency of therapy, ulcers, infections, and other consequences must be identified. As a result, machine learning tools, such as SVM models, were employed to classify energy intensity values, which were used as input characteristics. Because the study was carried out on PAD patients with DM, the intensity data were taken from the upper foot46, 47, 48, 34. The energy values were measured from approximately 21 regions of interest, including the shin, instep, and toes, since PAD is linked to artery routes in the upper foot34. The choice of 21 areas for feature extraction enabled a more comprehensive examination during the clinical decision-making process49, 50, 51.
The goal of this systematic review was to investigate the validity of a hybrid diagnostic method, in which current clinical approaches are supplemented with foot thermogram characteristics. Practical suggestions have been made for implementing these alternative and cost-effective treatment options in existing practices, so that clinicians can obtain the best possible outcomes for patients and the healthcare system, particularly in rural regions.
Conclusions
The studies examined for this review suggest that foot thermograms can provide clinicians with evidence-based options for the early detection of diabetic foot ulcers. Data from image processing, analysis, and classification can assist in promoting the healing process, reduce healing times, and enable more cost-effective clinical procedures. Due to the simplicity of the equipment employed, a diagnosis provided by a thermographic approach also gives patients an alternative for receiving precision therapy in the remote setting. The foot thermogram has considerable future potential as a diagnostic tool for diabetic foot ulcer.
Abbreviations
IDF: International Diabetes Federation, FU: Foot Ulcer, CT: Classification of Thermograms, IRT: Infrared Thermography, MCA: Medial Calcaneal Artery, MPA: Medial Plantar Artery, LCA: Lateral Calcaneal Artery, LPA: Lateral Plantar Artery, ABI: Ankle Brachial Index, TBI: Toe Brachial Index, DM: Diabetes Mellitus, PAD: Peripheral Arterial Disease, SVM: Support Vector Machine
Acknowledgments
None.
Author’s contributions
Conceptualization, K.C. and J.S.; methodology, K.C. and J.S; formal analysis, J.S.; investigation, K.C and J.S.; resources, K.C.; writing—original draft preparation, J.S.; writing—review and editing, K.C. and A.A; visualization, K.C.; supervision, K.C.; project administration, K.C.; funding acquisition, K.C. All authors have read and agreed to the published version of the manuscript.
Funding
None.
Availability of data and materials
Not applicable.
Ethics approval and consent to participate
Not applicable.
Consent for publication
Not applicable.
Competing interests
The authors declare that they have no competing interests.
References
-
Saeedi
P.,
Petersohn
I.,
Salpea
P.,
Malanda
B.,
Karuranga
S.,
Unwin
N.,
Diabetes Atlas Committee
IDF,
Global and regional diabetes prevalence estimates for 2019 and projections for 2030 and 2045: Results from the International Diabetes Federation Diabetes Atlas, 9th edition. Diabetes Research and Clinical Practice.
2019;
157
:
107843
.
View Article PubMed Google Scholar -
Hantzidiamantis
P.J.,
Lappin
S.L.,
Physiology, Glucose. [Updated 2019 Aug 13]. In: StatPearls [Internet]. Treasure Island (FL): StatPearls Publishing; 2020 Jan-. Available from: https://www.ncbi.nlm.nih.gov/books/NBK545201/.
.
-
Yang
M.L.,
Sodré
F.,
Mamula
M.J.,
Overbergh
L.,
Citrullination and PAD Enzyme Biology in Type 1 Diabetes Regulators of Inflammation, Autoimmunity, and Pathology. Frontiers in Immunology.
2021;
12
:
2001
.
View Article Google Scholar -
M. Etehadtavakol,
E.Y. Ng,
Assessment of foot complications in diabetic patients using thermography: a review. In Application of infrared to biomedical sciences, pp. 33-43. Springer, Singapore, 2017..
.
-
Cho
N.H.,
Shaw
J.E.,
Karuranga
S.,
Huang
Y.,
Fernandes
J.D. da Rocha,
Ohlrogge
A.W.,
IDF Diabetes Atlas: Global estimates of diabetes prevalence for 2017 and projections for 2045. Diabetes Research and Clinical Practice.
2018;
138
:
271-81
.
View Article Google Scholar -
Apelqvist
J.,
Larsson
J.,
What is the most effective way to reduce incidence of amputation in the diabetic foot?. Diabetes/Metabolism Research and Reviews.
2000;
16
(S1)
:
75-83
.
View Article PubMed Google Scholar -
Meloni
M.,
Izzo
V.,
Giurato
L.,
Lázaro-Martínez
J.L.,
Uccioli
L.,
Prevalence, clinical aspects and outcomes in a large cohort of persons with diabetic foot disease: comparison between neuropathic and ischemic ulcers. Journal of Clinical Medicine.
2020;
9
(6)
:
1780
.
View Article PubMed Google Scholar -
Pecoraro
R.E.,
Reiber
G.E.,
Burgess
E.M.,
Pathways to diabetic limb amputation. Basis for prevention. Diabetes Care.
1990;
13
(5)
:
513-21
.
View Article PubMed Google Scholar -
Singh
S.,
Jajoo
S.,
Shukla
S.,
Acharya
S.,
Educating patients of diabetes mellitus for diabetic foot care. Journal of Family Medicine and Primary Care.
2020;
9
(1)
:
367-73
.
View Article PubMed Google Scholar -
Huda
N.,
Nursalam
N.,
Sukartini
T.,
Pratiwi
S.A.,
Irawandi
D.,
The Impact of Family Confidence on Foot Care Behavior by Family Members Suffering from Diabetes Mellitus. International Journal of Psychosocial Rehabilitation.
2020;
24
(7)
.
-
Hanley
G.,
Chiou
P.Y.,
Liu
C.Y.,
Chen
H.M.,
Pfeiffer
S.,
Foot care knowledge, attitudes and practices among patients with diabetic foot and amputation in St. Kitts and Nevis. International Wound Journal.
2020;
17
(5)
:
1142-52
.
View Article PubMed Google Scholar -
Schaper
N.C.,
Van Netten
J.J.,
Apelqvist
J.,
Lipsky
B.A.,
Bakker
K.,
International Working Group on the Diabetic Foot (IWGDF)
Prevention and management of foot problems in diabetes: A Summary Guidance for Daily Practice 2015, based on the IWGDF guidance documents. Diabetes Research and Clinical Practice.
2017;
124
:
84-92
.
View Article PubMed Google Scholar -
Pinzur
Michael S.,
Slovenkai
Mark P.,
Trepman
Elly,
Shields
Naomi N.,
Society
Diabetes Committee of American Orthopaedic Foot and Ankle,
Guidelines for diabetic foot care: recommendations endorsed by the Diabetes Committee of the American Orthopaedic Foot and Ankle Society. Foot Ankle Int.
2005;
26
(1)
:
113-119
.
View Article PubMed Google Scholar -
Schmidt
R.F.,
G. Thews,
Human Physiology. Springer Science & Business Media, 2013.. 2013
.
-
Gatt
A.,
Formosa
C.,
Cassar
K.,
Camilleri
K.P.,
De Raffaele
C.,
Mizzi
A.,
Thermographic patterns of the upper and lower limbs: baseline data. International Journal of Vascular Medicine.
2015;
2015
:
831369
.
View Article PubMed Google Scholar -
M. Adam,
E.Y. Ng,
S.L. Oh,
M.L. Heng,
Y. Hagiwara,
J.H. Tan,
J.W. Tong,
U.R. Acharya,
Automated detection of diabetic foot with and without neuropathy using double density-dual tree-complex wavelet transform on foot thermograms. Infrared Physics & Technology.
2018;
92
:
270-279
.
View Article Google Scholar -
Armstrong
D.G.,
Lavery
L.A.,
Liswood
P.J.,
Todd
W.F.,
Tredwell
J.A.,
Infrared dermal thermometry for the high-risk diabetic foot. Physical Therapy.
1997;
77
(2)
:
169-75
.
View Article PubMed Google Scholar -
Ilo
A.,
Romsi
P.,
Mäkelä
J.,
Infrared thermography and vascular disorders in diabetic feet. Journal of Diabetes Science and Technology.
2020;
14
(1)
:
28-36
.
View Article PubMed Google Scholar -
Astasio-Picado
Á.,
Escamilla Martínez
E.,
Gómez-Martín
B.,
Comparative thermal map of the foot between patients with and without diabetes through the use of infrared thermography. Enfermeria Clinica.
2020;
30
(2)
:
119-23
.
View Article PubMed Google Scholar -
Gatt
A.,
Falzon
O.,
Cassar
K.,
Camilleri
K.P.,
Gauci
J.,
Ellul
C.,
The application of medical thermography to discriminate neuroischemic toe ulceration in the diabetic foot. The International Journal of Lower Extremity Wounds.
2018;
17
(2)
:
102-5
.
View Article PubMed Google Scholar -
Armstrong
D.G.,
Holtz-Neiderer
K.,
Wendel
C.,
Mohler
M.J.,
Kimbriel
H.R.,
Lavery
L.A.,
Skin temperature monitoring reduces the risk for diabetic foot ulceration in high-risk patients. The American Journal of Medicine.
2007;
120
(12)
:
1042-6
.
View Article PubMed Google Scholar -
Lavery
L.A.,
Higgins
K.R.,
Lanctot
D.R.,
Constantinides
G.P.,
Zamorano
R.G.,
Armstrong
D.G.,
Home monitoring of foot skin temperatures to prevent ulceration. Diabetes Care.
2004;
27
(11)
:
2642-7
.
View Article PubMed Google Scholar -
Hernandez-Contreras
D.,
Peregrina-Barreto
H.,
Rangel-Magdaleno
J.,
Gonzalez-Bernal
J.,
Narrative review: diabetic foot and infrared thermography. Infrared Physics & Technology.
2016;
78
:
105-17
.
View Article Google Scholar -
AG
Willmott,
M
Hayes,
J
Dekerle,
NS
Maxwell,
The reliability of a heat acclimation state test prescribed from metabolic heat production intensities. Journal of Thermal Biology.
2009;
34
(3)
:
120-6
.
View Article Google Scholar -
Lahiri
B.B.,
Bagavathiappan
S.,
Jayakumar
T.,
Philip
J.,
Medical applications of infrared thermography: A review. Infrared Physics & Technology.
2012;
55
(4)
:
221-35
.
View Article PubMed Google Scholar -
Liu
C.,
Heijden
F. van der,
Klein
M.E.,
Baal
J.G. van,
Bus
S.A.,
Netten
J.J. van,
Infrared dermal thermography on diabetic feet soles to predict ulcerations: a case study. In Advanced Biomedical and Clinical Diagnostic Systems XI, vol. 8572, p. 85720N. International Society for Optics and Photonics, 2013.
.
-
Nagase
T.,
Sanada
H.,
Takehara
K.,
Oe
M.,
Iizaka
S.,
Ohashi
Y.,
Variations of plantar thermographic patterns in normal controls and non-ulcer diabetic patients: novel classification using angiosome concept. Journal of Plastic, Reconstructive & Aesthetic Surgery.
2011;
64
(7)
:
860-6
.
View Article PubMed Google Scholar -
J.J. van Netten,
J.G. van Baal,
C. Liu,
F. van Der Heijden,
S.A. Bus,
Infrared thermal imaging for automated detection of diabetic foot complications. J Diabetes Sci Technol.
2013;
7
(5)
:
1122-1129
.
View Article PubMed Google Scholar -
Mori
Taketoshi,
Nagase
Takashi,
Takehara
Kimie,
Oe
Makoto,
Ohashi
Yumiko,
Amemiya
Ayumi,
Noguchi
Hiroshi,
Ueki
Kohjiro,
Kadowaki
Takashi,
Sanada
Hiromi,
Morphological Pattern Classification System for Plantar Thermography of Patients with Diabetes. J Diabetes Sci Technol.
2013;
7
(5)
:
1102-1112
.
View Article PubMed Google Scholar -
Hazenberg
C.E.,
Netten
J.J. van,
Baal
S.G. van,
Bus
S.A.,
Assessment of signs of foot infection in diabetes patients using photographic foot imaging and infrared thermography. Diabetes Technology & Therapeutics.
2014;
16
(6)
:
370-7
.
View Article PubMed Google Scholar -
Netten
J.J. van,
Prijs
M.,
Baal
J.G. van,
Liu
C.,
Heijden
F. van der,
Bus
S.A.,
Diagnostic values for skin temperature assessment to detect diabetes-related foot complications. Diabetes Technology & Therapeutics.
2014;
16
(11)
:
714-21
.
View Article PubMed Google Scholar -
Liu
C.,
van Netten
J.J.,
van Baal
J.G.,
Bus
S.A.,
van der Heijden
F.,
Automatic detection of diabetic foot complications with infrared thermography by asymmetric analysis. Journal of Biomedical Optics.
2015;
20
(2)
:
26003
.
View Article PubMed Google Scholar -
Gatt
A.,
Cassar
K.,
Falzon
O.,
Ellul
C.,
Camilleri
K.P.,
Gauci
J.,
The identification of higher forefoot temperatures associated with peripheral arterial disease in type 2 diabetes mellitus as detected by thermography. Primary Care Diabetes.
2018;
12
(4)
:
312-8
.
View Article PubMed Google Scholar -
Padierna
L.C.,
Amador-Medina
L.F.,
Murillo-Ortiz
B.O.,
Villaseñor-Mora
C.,
Classification Method of Peripheral Arterial Disease in Patients with type 2 Diabetes Mellitus by Infrared Thermography and Machine Learning. Infrared Physics & Technology.
2020;
111
:
103531
.
View Article Google Scholar -
Hernandez-Contreras
D.,
Peregrina-Barreto
H.,
Rangel-Magdaleno
J.,
Gonzalez-Bernal
J.A.,
Altamirano-Robles
L.,
A quantitative index for classification of plantar thermal changes in the diabetic foot. Infrared Physics & Technology.
2017;
81
:
242-9
.
View Article Google Scholar -
Marina
C.N.,
Raducu
L.,
Ardeleanu
V.,
Florescu
I.P.,
Jecan
C.R.,
Thermographic camera in traumatology, diabetic foot and reconstructive procedures. Injury.
2020;
51
:
117-20
.
View Article PubMed Google Scholar -
Lavery
L.A.,
Higgins
K.R.,
Lanctot
D.R.,
Constantinides
G.P.,
Zamorano
R.G.,
Athanasiou
K.A.,
Preventing diabetic foot ulcer recurrence in high-risk patients: use of temperature monitoring as a self-assessment tool. Diabetes Care.
2007;
30
(1)
:
14-20
.
View Article PubMed Google Scholar -
Bagavathiappan
S.,
Philip
J.,
Jayakumar
T.,
Raj
B.,
Rao
P.N.,
Varalakshmi
M.,
Correlation between plantar foot temperature and diabetic neuropathy: a case study by using an infrared thermal imaging technique. Journal of Diabetes Science and Technology.
2010;
4
(6)
:
1386-92
.
View Article PubMed Google Scholar -
Armstrong
D.G.,
Holtz-Neiderer
K.,
Wendel
C.,
Mohler
M.J.,
Kimbriel
H.R.,
Lavery
L.A.,
Skin temperature monitoring reduces the risk for diabetic foot ulceration in high-risk patients. The American Journal of Medicine.
2007;
120
(12)
:
1042-6
.
View Article PubMed Google Scholar -
Sun
P.C.,
Jao
S.H.,
Cheng
C.K.,
Assessing foot temperature using infrared thermography. Foot & Ankle International.
2005;
26
(10)
:
847-53
.
View Article PubMed Google Scholar -
Faraz
A.,
Ashraf
H.,
Khalid
S.,
Fatima
R.,
Foot Pressure Abnormalities, Radiographic, and Charcot Changes in the Diabetic Foot. InDiabetic Foot UlcerSpringer: Singapore; 2021.
Google Scholar -
Lung
C.W.,
Wu
F.L.,
Liao
F.,
Pu
F.,
Fan
Y.,
Jan
Y.K.,
Emerging technologies for the prevention and management of diabetic foot ulcers. Journal of Tissue Viability.
2020;
29
(2)
:
61-8
.
View Article PubMed Google Scholar -
Sun
P.C.,
Lin
H.D.,
Jao
S.H.,
Ku
Y.C.,
Chan
R.C.,
Cheng
C.K.,
Relationship of skin temperature to sympathetic dysfunction in diabetic at-risk feet. Diabetes Research and Clinical Practice.
2006;
73
(1)
:
41-6
.
View Article PubMed Google Scholar -
Ward
J.D.,
Boulton
A.J.,
Simms
J.M.,
Sandler
D.A.,
Knight
G.,
Venous distension in the diabetic neuropathic foot (physical sign of arteriovenous shunting). Journal of the Royal Society of Medicine.
1983;
76
(12)
:
1011-4
.
View Article PubMed Google Scholar -
Fagrell
B.,
Jörneskog
G.,
Intaglietta
M.,
Disturbed microvascular reactivity and shunting - a major cause for diabetic complications. Vascular Medicine.
1999;
4
(3)
:
125-7
.
View Article PubMed Google Scholar -
Gururajarao
S.B.,
Venkatappa
U.,
Shivaram
J.M.,
Sikkandar
M.Y.,
Amoudi
A. Al,
Infrared thermography and soft computing for diabetic foot assessment. InMachine Learning in Bio-Signal Analysis and Diagnostic Imaging 2019 Jan 1 (pp. 73-97). Academic Press..
.
-
Vardasca
R.,
Magalhaes
C.,
Seixas
A.,
Carvalho
R.,
Mendes
J.,
Diabetic foot monitoring using dynamic thermography and AI classifiers. Proceedings of QIRT Asia 2019.
2019
.
View Article Google Scholar -
Adam
M.,
Ng
E.Y.,
Oh
S.L.,
Heng
M.L.,
Hagiwara
Y.,
Tan
J.H.,
Automated characterization of diabetic foot using nonlinear features extracted from thermograms. Infrared Physics & Technology.
2018;
89
:
325-37
.
View Article Google Scholar -
Hutting
K.H.,
Aan de Stegge
W.B.,
Kruse
R.R.,
van Baal
J.G.,
Bus
S.A.,
van Netten
J.J.,
Infrared thermography for monitoring severity and treatment of diabetic foot infections. Vasc Biol.
2020;
2
(1)
:
1-10
.
View Article PubMed Google Scholar -
Cruz-Vega
I.,
Peregrina-Barreto
H.,
Rangel-Magdaleno
J. de Jesus,
Ramirez-Cortes
J.M.,
A comparison of intelligent classifiers of thermal patterns in diabetic foot. 2019 IEEE International Instrumentation and Measurement Technology Conference (I2MTC).
2019;
2019
:
1-6
.
View Article Google Scholar -
Pai
M.M.,
Jain
K.,
Manjunath
K.N.,
Kolekar
S.V.,
Pai
R.M.,
Early detection of foot complications using a thermal profiler of plantar surface. International Journal of Sensor Networks..
2020;
33
(1)
:
16-24
.
View Article Google Scholar
Comments
Article Details
Volume & Issue : Vol 9 No 5 (2022)
Page No.: 5029-5042
Published on: 2022-05-31
Citations
Copyrights & License
This work is licensed under a Creative Commons Attribution 4.0 International License.
Search Panel
Pubmed
Google Scholar
Pubmed
Google Scholar
Pubmed
Search for this article in:
Google Scholar
Researchgate
- HTML viewed - 7487 times
- PDF downloaded - 1832 times
- XML downloaded - 0 times
