

Copyrights: Ahmed Salah, Alaa Hussein, Soha A. Hassan, Mohammed Abdalla Hussein, Khalid Bassiouny, 2022. License: This work is licensed under a Creative Commons Attribution 4.0 International License.
Abstract
Introduction: Resveratrol (RES) is a multi-biofunctional compound found in grapes and mulberries. The present investigation was aimed at the green synthesis of resveratrol-carboxymethyl nanoparticles using low viscosity chitosan (RES-CMCS) and evaluation of their antidiabetic and antiobesity activity.
Methods: The obtained RES-CMCS was analyzed via measurement of zeta potential, particle size, morphology, and entrapment effectiveness. Its antidiabetic and antiobesity activities were also examined in an obese rat model.
Results: The mean size of the RES-CMCS nanoparticles was 54.7 nm, the zeta potential was (-) 59.4 mV, and the entrapment effectiveness was 85.46%, with spherical nanoparticle morphology detected. In addition, treatment of obese diabetic rats with RES-CMCS (25 and 50 mg) as well as metformin (500 mg/kg.b.w) resulted in the normalization of several physiological parameters including body weight, levels of blood glucose, lipid profile, oxidative stress indicators, and expression of GLUT-4 and leptin genes.
Conclusions: The findings show the potential for RES-CMCS as a new pharmaceutical medication method for the treatment of obesity via modulation of antioxidant enzymes and expression of GLUT-4 and leptin.
Introduction
Obesity is a complex disease that stems from excess body fat1. It is an expanding public health problem worldwide, creating a global health epidemic2. According to a 2016 World Health Organization report, obesity has nearly tripled since 1980, with 1.9 billion adults worldwide who are considered overweight, including 650 million with obesity3. Obesity has long been associated with an increased risk of cardiovascular disease. The aim of diabetes treatment is to avoid microvascular complications (retinopathy, nephropathy, neuropathy, and microangiopathy); intensive glycemic control has been shown to minimize the risk of long-term complications4. Because of the elevation of plasma lipids, which contributes to early cardiovascular disease and atherosclerosis in diabetic patients, the optimum diabetes treatment should enhance the lipid profile in addition to managing glucose.
Many studies have shown that metformin can promote weight loss in overweight or obese patients5, 6. Resveratrol, a substance found in grapes, blueberries, peanuts7, and red wine7 has antioxidant and free radical scavenging properties8, as well as anti-cholestatic activity9. It has been shown to be beneficial in diabetic hyperglycemia and dyslipidemia control10.
Chitosan-based nanomaterials are among the most widely explored natural polysaccharides due to their biocompatibility, biodegradability, relatively low cost, antibacterial and cationic nature, and low toxicity11. The mechanism of chitosan nanoparticle production requires an electrostatic interaction between the amine group of chitosan and the negatively charged group of a polyanion, such as a hydroxide anion12.
Nanotechnology is now widely employed for the prevention and treatment of infectious and noninfectious disorders to better target immune responses13. Localized nano-immunotherapy increases the level of immunostimulatory chemicals by reducing systemic toxicity14, 15, while drug encapsulation in nanoform is a promising way to increase drug solubility and biodistribution. Furthermore, unwanted interactions, breakdown of drugs before reaching target tissues and cells, and nonspecific drug accumulation in other tissues can also be avoided16. Physicochemical parameters such as molecular weight, solubility, diffusivity, and viscosity are used to select the carrier material17.
Encapsulation protects bioactive ingredients, extends storage life, and preserves the finished product. It is also utilized to control the dissolution profile and assist the drug to reach the target location18, 19.
Resveratrol has been tested in vivo and displays anti-inflammatory properties in bowel disease20, 21. However, no studies have been performed on the effects of resveratrol nanoparticles in the treatment of obesity. Here, we present a simple method to assess the therapeutic potential of resveratrol nanoemulsions in a rat model of obesity induced by a high-fat diet (HFD), as part of our ongoing research program to determine the medicinal value of resveratrol 9, 14, 15, 22, 23.
Materials and Methods
Materials
Carboxymethyl chitosan (CMCS) and buffers (Sigma–Aldrich Chemical Co. catalog NO. T7517-5G), triglyceride tripalmitate (Sigma–Aldrich, Aldrich Chemical Co. catalog NO. T8127-100G), soy lecithin (Avanti Polar Lipids catalog NO. 206775), and chloroform were used.
RES-CMCSNP preparation and optimization
Resveratrol (RES)-CMCSNPs were prepared according to the method of Elgizawy et al.24, 25 with some modifications. Briefly, CMCS was completely dissolved in water, appropriate amounts of Tween 80 were added, and impurities were removed by filtration. Then, appropriate amounts of chloroform were added dropwise at a speed of 10,000 rpm. Homogeneity after high-pressure homogenization (400 to 1200 bars) indicated that materials were refined and uniformly mixed in the homogenizing valve and the emulsified solution, thereby resulting in smaller, more uniform and stable nanoparticles. Nanoparticle size was the indicator of the inspection. After completion of the emulsification process, we used anhydrous calcium chloride as a cross-linking agent. CMCS is an amphoteric electrolyte that has a negative charge under alkaline conditions. Inter- or intramolecular cross-linking reactions between the weak acid anionic group (COO-) and Ca2+ ions can occur, resulting in nanoparticles. The quality of the added CaCl2 can directly affect the particle size of the nanoparticles, as well as potential, entrapment efficiency, and drug-loading amount, while CaCl2 concentration has been shown to be a critical factor in single-factor experiments. Tween-80 was added to the CMCS solution, and resveratrol was sufficiently dissolved in chloroform. Chloroform was added dropwise to the CMCS solution under stirring in a homogenizer, and high-pressure homogenization was carried out, resulting in emulsification of the homogenate. CaCl2 solution was added dropwise to the emulsion. Following completion of the cross-linking process, we detected the particle size and potential of each sample. Chloroform was removed using a rotary evaporator under vacuum and centrifugation at 10,000 rpm for 30 min. The nanoparticles were separated, the precipitate and the supernatant were collected, and the precipitate was washed twice with ultrapure water. The supernatant was used to determine encapsulation efficiency and drug loading. RES-CMCSNPs were freeze-dried at -50°C for 48 h. In this process, 50% (mannitol percentage of RES-CMCS quality) mannitol was selected as the lyophilized protective agent for these particles.
RES-CMCS characterization and morphology
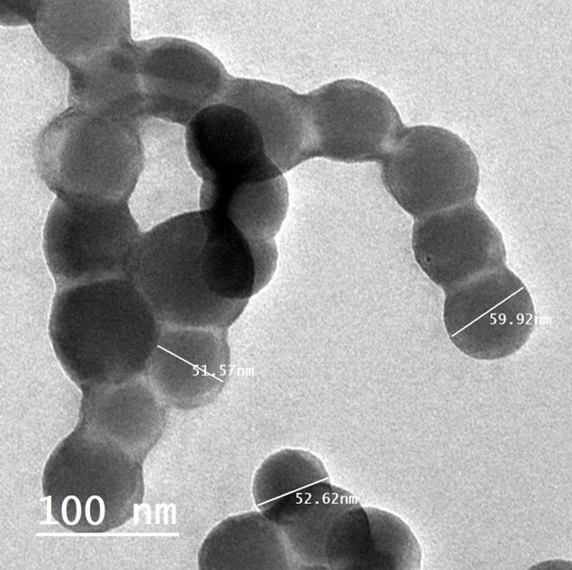
SEM (JSM-690, JEOL, Inc., Tokyo, Japan) and FETEM (JSM-2100F, JEOL Inc.) at 200 kV were used to study the morphological properties of RES-CMCS. Infrared spectral data were also used to analyze the structure of the particles (Shimadzu MR 470, Japan). A droplet of nanoparticles was placed on top of the carbon coating and left to sit for 24 hours at room temperature. The TEM images showed that the RES-CMCS particles had circular morphology and an average diameter of approximately 98 nm.
Entrapment efficiency
RES-CMCS (5.0 mg) was crushed and distributed in a mixture of 5.0 mL distilled water and 5.0 mL ethyl acetate; the ethyl acetate phase was separated by gentle shaking. A UV–Vis spectrophotometer was used to quantify the amount of free resveratrol in the ethyl acetate phase at 419 nm. The following equation was then used to compute drug entrapment efficiency (percentage)1:
Animals
This experiment was conducted in accordance with guidelines established by the Animal Care and Use Committee of the Faculty of Applied Medical Sciences, October 6 University, Egypt. Forty-two adult male albino rats weighing 180 ± 10 g were purchased from the National Cancer Institute, Cairo University. They were individually housed in cages in an air-conditioned room at a temperature of 22 ± 2 °C, relative humidity of 60%, and an 8:00 to 20:00 light cycle. During the acclimatization period, each animal was raised on a regular diet ad libitum.
| Groups | Treatment description |
|---|---|
| (I) | Was received RD for 8-weeks period. |
| (II) | Was fed RD + RES-CMCS (25 mg/kg.b.w.) for 8-week period 24 |
| (III) | Was fed RD + RES-CMCS (50 mg/kg.b.w) for an 8-week period 24 |
| (IV) | Was received HFD for 8-weeks period |
| (V) | Was fed HFD + RES-CMCS (25 mg/kg.b.w.) for 8-week period 24 |
| (VI) | Was fed HFD + RES-CMCS (50 mg/kg.b.w) for an 8-week period 24 |
| (VII) | Was HFD + metformin (500 mg/kg.b.w.) for an 8-weeks period 25 |
Experimental design
This experiment was designed to examine the biochemical effects of RES-CMCS on HFD-induced obesity in rats. Data collection was ethically approved by the Research Ethics Committee of the Faculty of Applied Medical Sciences, October 6 University in Egypt (No. 20210902). Seven groups of animals, each consisting of six rats, were treated daily for 8 weeks as follows (Table 1).
Obesity was induced by administering RD from Dyets Inc. (Bethlehem, PA, USA) plus 200 g of fat/kg RD and 1% (w/w) cholesterol26. Body weights were measured biweekly.
Blood sampling and biochemical assays
Blood samples were collected in heparinized test tubes and centrifuged; fresh plasma was used for the colorimetric estimation of plasma glucose26 and the detection of insulin using an ELISA kit (Alpco Diagnostics)27. Plasma TG, TC, and HDL-C were measured using diagnostic kits28, 29, 30.
Additionally, the liver was removed directly and homogenized in phosphate-buffered saline (pH 7.4, 1 ml) for the estimation of hepatic TBARS, GSH, and SOD levels31, 32, 33.
RT–PCR
Sepasol-RNA1Super was used to extract total RNA from adipose tissues. Isolated RNA (10–15 µg) was used to quantify leptin and GLUT-4 expression by real-time PCR as previously described34. Quantitative RT–PCR data are presented as % of control.
The primer sequences were leptin-F: 5′- GCCAGGCTGCCAGAATTG -3′ and leptin -R: 5′- CTGCCCCCCAGTTTGATG -3’; and GLUT4- F: 5´GAGCCTGAATGCTAATGGAG3´ and R 5´GAGAGAGAGCGTCCAATGTC3´. The internal control was β-actin mRNA. Primer sequences were β-actin-F: 5′- AGAGGGAAATCGTGCGTGAC-3’ and β-actin -R: 5′- CAATAGTGA TGACCTGGCCGT-3’.
Histopathological examination
Specimens of liver tissue were collected and fixed in 10% neutral buffered formalin, dehydrated through an ascending series of ethyl alcohol solutions (50% — 100%), and cleared in xylene (three changes), before embedding in melted paraffin wax (MP 59°C). The paraffin blocks were sectioned at a thickness of 5–6 microns using a rotary microtome. Sections were stained using hematoxylin and eosin (H&E) as described by Bancroft and Steven35 and examined using an Olympus (Münster, Germany) light microscope. Photomicrographs of the liver tissue were taken at x 400 magnification.
Statistical analysis
For each of the six different analyses, the results were reported as mean ± SD. SPSS/18 was used to statistically evaluate all data36. One-way analysis of variance was performed to evaluate the hypotheses, followed by the least significant difference test (p < 0.05).
| Drugs | Retention Time (min) | Peak Area (uV*sec) | Resveratrol Concentration ( μ g/ml) |
|---|---|---|---|
| RES | 6.42 | 299340 | 152.5 |
| RES-CMCS | 6.42 | 1610156 | 821.6 |
| Drugs | Entrapment efficiency (%) | Particle size (nm) | Polydispersity index | ZETA potential (mv) |
|---|---|---|---|---|
| RES-CMCS | 85.46 | 98.4 ± 2.2 | 0.623 | +31.60 |

| No. | Groups | Number of weeks Body weight of rats (g) | ||||
|---|---|---|---|---|---|---|
| 0 | 2 | 4 | 6 | 8 | ||
| (I) | Regular diet (RD) | 187.4 ± 10.8 Aa | 195.5 ± 12.7 Aa | 208.0 ± 11.3 Bb | 210.2 ± 14.9 Bb | 225.8 ± 10.55 Cc |
| (II) | RD+ RES-CMCS (25 mg/kg.b.w.) | 188.6 ± 9.6 Aa | 194.7 ± 14.0 Aa | 200.3 ± 8.70 Ba | 206.8 ± 10.8 Ca | 217.90 ± 12.60 Db |
| (III) | RD+ RES-CMCS (50 mg/kg.b.w.) | 192.8 ± 8.2 Aa | 196.5 ± 11.90 Aa | 201.8 ± 14.50 Ba | 203.5 ± 11.65 Ba | 210.4 ± 13.90 Ca |
| (IV) | High-fat diet (HFD) | 186.5 ± 7.4 Aa | 215.8 ± 13.5 Bb | 246.5 ± 11.2 Cd | 264.90 ± 7.9 Dd | 287.8 ± 8.4 Ee |
| (V) | HFD+ RES-CMCS (25 mg/kg.b.w.) | 188.7 ± 9.5 Aa | 200.6 ± 10.8 Aa | 219.8 ± 16.5 Bc | 225.6* ± 14.3 Bc | 235.6 ± 15.9 Cd |
| (VI) | HFD+ RES-CMCS (50 mg/kg.b.w.) | 186.6 ± 10.0 Aa | 202.8 ± 12.7 Aa | 209.5 ± 8.9 Bb | 213.6 ± 8.70 Bb | 227.7 ± 9.8 Cc |
| (VII) | HFD + Metformin (500 mg/kg.b.w.) | 184.9 ± 8.50 Aa | 206.8 ± 9.5 Bb | 211.5 ± 10.5 Bb | 215.70 ± 13.4 Bb | 228.4 ± 8.9 Cc |
| No. | Groups | Plasma insulin (mmol/L) | Plasma glucose (mmol/L) |
|---|---|---|---|
| (I) | Regular diet (RD) | 2.52 ± 0.12 a | 5.86 ± 0.42 a |
| (II) | RD+ RES-CMCS (25 mg/kg.b.w.) | 2.58 ± 0.28 a | 5.92 ± 0.44 a |
| (III) | RD+ RES-CMCS (50 mg/kg.b.w.) | 2.64 ± 0.22 a | 6.09 ± 0.34 a |
| (IV) | High-fat diet (HFD) | 3.28 ± 0.37 b | 8.30 ± 0.56 c |
| (V) | HFD+ RES-CMCS (25 mg/kg.b.w.) | 3.02 ± 0.43 | 7.84 ± 0.43 |
| (VI) | HFD+ RES-CMCS (50 mg/kg.b.w.) | 2.56 ± 0.26 a | 7.03 ± 0.55 a |
| (VII) | HFD + Metformin (500 mg/kg.b.w.) | 2.62 ± 0.24 | 6.85 ± 0.6 a |
| No. | Groups | TC (mmol/L) | TG (mmol/L) | HDL-C (mmol/L) |
|---|---|---|---|---|
| (I) | Regular diet (RD) | 2.65 ± 0.24 a | 0.98 ± 0.07 a | 1.36 ± 0.07 a |
| (II) | RD+ RES-CMCS (25 mg/kg.b.w.) | 2.77 ± 0.28 a | 0.94 ± 0.08 a | 1.39 ± 0.06 a |
| (III) | RD+ RES-CMCS (50 mg/kg.b.w.) | 2.62 ± 0.32 a | 0.88 ± 0.07 a | 1.40 ± 0.11 a |
| (IV) | High-fat diet (HFD) | 5.15 ± 0.28 c | 1.80 ± 0.12 c | 0.86 ± 0.09 c |
| (V) | HFD+ RES-CMCS (25 mg/kg.b.w.) | 4.27 ± 0.29 b | 1.50 ± 0.09 b | 1.13 ± 0.10 |
| (VI) | HFD+ RES-CMCS (50 mg/kg.b.w.) | 3.62 ± 0.36 b | 1.20 ± 0.10 b | 1.33 ± 0.07 a |
| (VII) | HFD + Metformin (500 mg/kg.b.w.) | 3.11 ± 0.31 b | 0.98 ± 0.10 a | 1.39 ± 0.09 a |
| No. | Groups | TBARS (nmol MDA/g tissue) | GSH (mg/100 g tissue) | SOD (U/mg protein) |
|---|---|---|---|---|
| (I) | Regular diet (RD) | 9.16 ± 0.61 a | 36.80 ± 4.73 a | 131.08 ±9.34 a |
| (II) | RD+ RES-CMCS (25 mg/kg.b.w.) | 8.66 ± 0.37 a | 37.48 ± 3.25 a | 136.97 ±8.5 a |
| (III) | RD+ RES-CMCS (50 mg/kg.b.w.) | 8.50 ± 0.46 a | 37.67 ± 3.21 a | 140.89 ± 5.94 a |
| (IV) | High-fat diet (HFD) | 18.73 ± 0.73 c | 21.96 ± 1.67 c | 58.68 ±36.35 c |
| (V) | HFD+ RES-CMCS (25 mg/kg.b.w.) | 13.98 ± 1.07 b | 28.7 ± 2.26 b | 120.0 ± 9.86 |
| (VI) | HFD+ RES-CMCS (50 mg/kg.b.w.) | 11.07 ± 0.76 a | 35.78 ± 4.47 b | 135.42 ± 6.14 a |
| (VII) | HFD + Metformin (500 mg/kg.b.w.) | 10.36 ± 0.55 a | 34 ± 4.34 a | 129.50 ±8.53 a |


Results
High-performance liquid chromatography carried out on resveratrol and RES-CMCS revealed similar patterns, with retention times of 6.42 and 6.42 and peak areas of 299340 and 1610156, respectively (Table 2).
The entrapment efficiency (%), particle size, polydispersity index, and zeta potential values of RES-CMCS are shown in Figure 2 and Table 3. Particle size was 54.7 ± 4.55 nm and zeta potential was (-) 59.4 mV, while entrapment efficiency and polydispersity index values were 85.46% and 0.623, respectively. During the 8-week period, the body weight of the RD rats increased gradually, as shown in Table 4. In comparison, the weight of the HFD group increased significantly during the same period. After 8 weeks, rats given RES-CMCS (25 or 50 mg/kg.b.w.) and metformin (500 mg/kg.b.w.) had lost 18.13%, 20.9%, and 20.6% of their body weight, respectively, compared with the HFD group (p < 0.05).Table 5 shows the levels of plasma insulin and glucose in the RD- and HFD-treated groups. Plasma levels of insulin and glucose were found to be significantly elevated (1.3- and 1.4-fold) in HFD-fed rats, compared with RD-fed rats. After administration of RES-CMCS (25 and 50 mg/kg.b.w.) and metformin (500 mg/kg.b.w.) for 8 weeks, the levels of plasma insulin and glucose were significantly reduced, compared with levels in the HFD group (p < 0.05).Plasma levels of TC and TG were significantly increased (1.8- and 1.9-fold, respectively; p < 0.05), while levels of plasma HDL-C were significantly decreased (1.6-fold, p < 0.05) in the HFD-fed group of rats, compared with levels in the RD-fed group (Table 6). RES-CMCS (25 and 50 mg/kg.b.w) and metformin (500 mg/kg.b.w.) treatment resulted in decreased TG and TC as well as increased HDL-C, compared with the HFD group (p < 0.05).
In addition, levels of hepatic TBARS were significantly increased (2.0-fold), while levels of GSH and SOD were significantly decreased (1.67- and 2.23-fold, respectively) in the HFD-fed group, compared with the RD-fed rats (Table 7). RES-CMCS (25 and 50 mg/kg.b.w) and metformin (500 mg/kg.b.w.) treatment significantly decreased TBARS and significantly increased GSH and SOD levels, in comparison with the HFD group (p < 0.05).
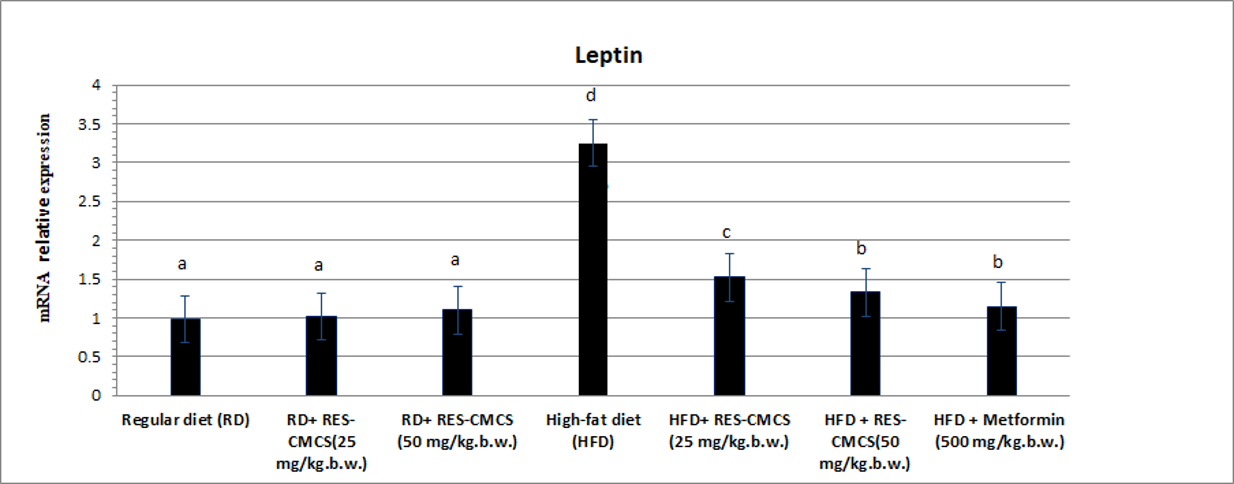
RT-PCR analysis of adipose tissues showed that leptin expression was significantly higher and GLUT-4 gene expression was significantly lower in the HDF-fed group than in the RD-fed group (p < 0.05; Figure 3, Figure 4). In rats treated with RES-CMCS (25 and 50 mg/kg.b.w.) and metformin (500 mg/kg.b.w.), the level of leptin gene expression was significantly suppressed, while GLUT-4 gene expression level was markedly increased, in comparison with the HFD control group (p < 0.05). Agarose gel electrophoresis images of GLUT-4, leptin, and beta-actin genes amplified in adipose tissue are shown in Figure 5.
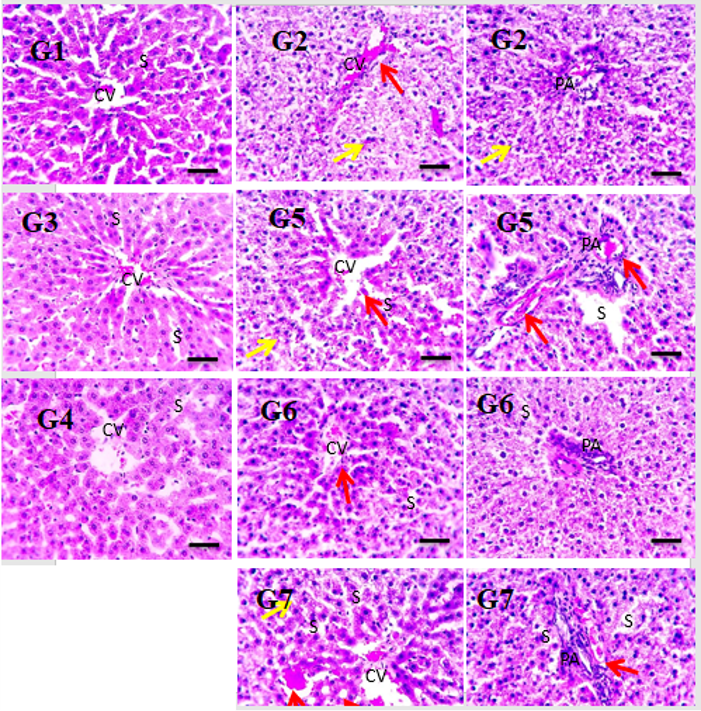
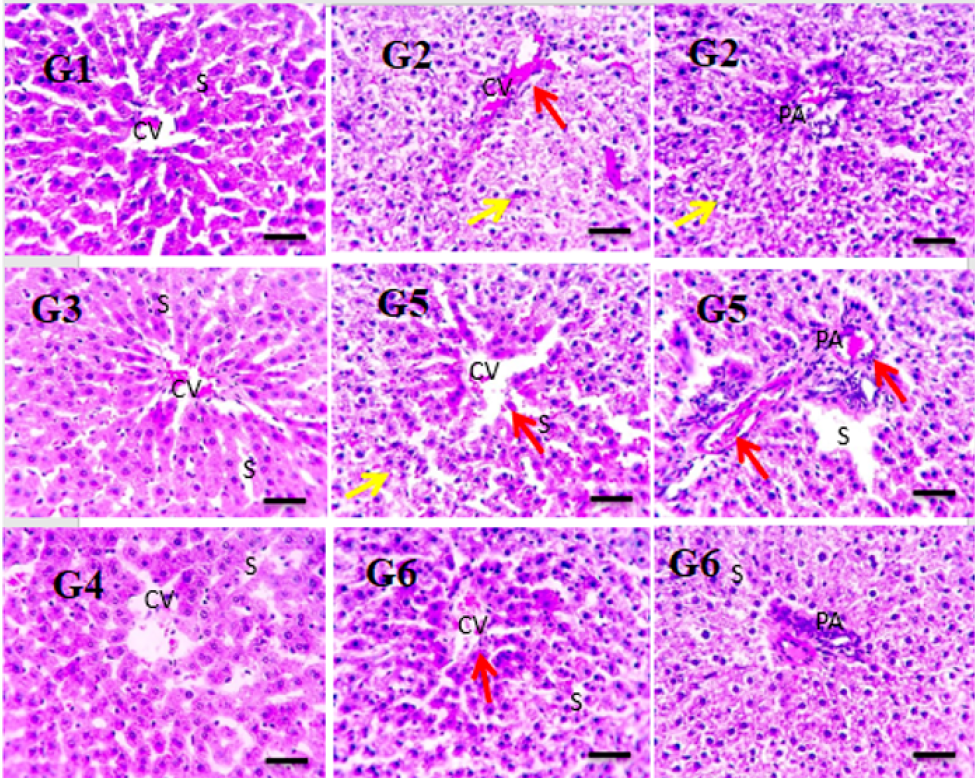
Photomicrographs of H&E-stained liver sections show the normal organization of hepatic parenchyma in the control group (GT1) and groups II & III; this consists of radially arranged hepatic lobules around the central veins, portal area, and sinusoids. Liver sections from the HFD group (IV) showed greatly disrupted hepatic parenchyma due to diffuse hydropic degeneration in hepatocytes (yellow arrows), as well as narrowed or occluded sinusoids in some sections; in addition, congested central and portal veins (red arrows), as well as inflammatory cells in portal areas (black arrows) were apparent. Liver sections from the pretreated group (V) showed mild congestion and fewer inflammatory cells in portal areas (black arrows). Liver sections from the treated group (VI) showed markedly improved histology (images were acquired at high magnification [x 400], bar 50; see Figure 6).
Discussion
Resveratrol is a natural molecule that may be used to prevent and treat a number of illnesses. However, its antitumor effectiveness is limited by its low stability and cellular bioavailability. To improve its stability and bioactivity, researchers have employed two methods, one producing a resveratrol peracetate ester37 or resveratrol-docosapentaenoic acid ester38 and another using nanocarriers such as nanoliposomes39 or RES-CMCS25. Lipophilic resveratrol prodrugs are created as a result of chemical alteration and require chemical cleavage to release nonencapsulated resveratrol; however, encapsulated substances can leak out of nanoliposomes due to instability. These issues do not apply to RES-CMCS, which is frequently utilized in pharmaceutical and nutraceutical research.
Chitosan requires certain features for ionic contact with resveratrol:
The presence of lone pairs of electrons in trans-hydroxyl resveratrol groups facilitates the formation of hydrogen bonds with the amino groups in chitosan (Figure 1).
The infrared spectrum of raw resveratrol powder showed a phenol hydroxyl group absorption peak at 3252 cm-1 as well as benzene ring absorption peaks at 2827 and 2920 cm. The infrared spectrum of the chitosan-coated resveratrol (RES-CMCS) demonstrated that a distinctive absorption peak emerged at the same place, while the resveratrol absorption peak was missing, indicating that resveratrol had been completely coated in chitosan.
Our findings are consistent with previous studies showing that adding chitosan in the presence of tripolyphosphate increased particle size. The polydispersity index (PI) was also employed to measure the uniformity or dispersity homogeneity of the nanoparticles, showing a value of 0.623 for RES-CMCS. The current data show heterogeneous dispersion of RES-CMCS25. Furthermore, resveratrol has been shown to be better protected from trans-to-cis isomerization in the presence of proteins than in the free form40, 41, 42, 43. The size of the RES-CMCS particles was measured in this study (Figure 2).
Our study showed an entrapment efficiency of 85.46% for RES-CMCS, thus demonstrating a satisfactory level of trapping of resveratrol in nanoparticles (greater than 70%). At pH 7, the NH3+ group in chitosan is deprotonated, resulting in a negatively charged NH2 group. Additionally, the negatively charged hydroxyl group of resveratrol can no longer bind to the NH2 group of chitosan, resulting in the release of resveratrol from nanoparticles.
Obesity has been related to the development of major human ailments, such as heart disease, diabetes, and cancer. In humans and animals, increased consumption of high-calorie (energy as well as fat) foods promotes fat accumulation, weight gain, and adiposity44. Nutritional supplement-based over-the-counter therapies are popular, especially for obesity and body composition. Obesity treatments are targeted at inhibiting dietary fat digestion and absorption45.
The antiobesity effects of RES-CMCS were investigated using rats fed an HFD as a model of obese type II diabetes46. RES-CMCS showed antiobesity effects, significantly suppressing the increases in body weight (Table 4). Furthermore, RES-CMCS reduced the levels of plasma glucose and insulin levels observed in the HFD group. Although there is no direct evidence that RES-CMCS affects insulin release in obese diabetic rats, activation of β-cell electrical activity by RES-CMCS could potentially stimulate insulin release. This result is consistent with previous findings47.
The antiobesity effects of RES-CMCS were discovered to significantly reduce the observed increases in plasma lipid content (Table 6). Additionally, fat build-up was reduced, indicating that the treatment suppressed TG, TC, and HDL-C. Apo-B-carrying lipoprotein fractions are assumed to be responsible for cholesterol deposition in atherosclerotic plaques47. Therefore, this change could be attributable to a decrease in cholesterol as well as triacylglycerols, which would be beneficial clinically.
Our results were in agreement with those of El Gizawy et al.47, who found that dietary resveratrol supplementation lowered the levels of low plasma density lipoprotein, very low-density lipoprotein, and total cholesterol in liver rats. Lower levels of plasma cholesterol as well as triacylglycerol-fed rats may be connected to changes in the activity of two essential enzymes in cholesterol metabolism, HMG-CoA reductase and cholesterol 7-hydroxylase. Although the activity of HMG-CoA reductase was not investigated in this study or earlier resveratrol studies, Hussein46 hypothesized that activation of hepatic cholesterol-7-hydroxylase activity could mediate the cholesterol-lowering effect. Additionally, according to Jung et al.48, polyphenols reduce the activity of hepatic HMG-CoA reductase in type II diabetic mice.
We also showed that the HFD control group had significantly higher liver TBARS levels but lower GSH and SOD levels. Hyperglycemia induces oxidative stress by inducing the production of reactive oxygen species (ROS). ROS cause organ harm in systems including the heart and liver, and oxidative damage is often more severe in diabetic patients46. Antioxidant enzyme activity in the livers of HFD-fed rats was normalized to cholesterol and triacylglycerol levels. It is possible that enhancing the levels of these enzymes in the liver through the action of the tested substances helped preserve the antioxidant equilibrium in HFD-fed rats. According to several in vivo and in vitro investigations, resveratrol reduced lipid peroxidation and enhanced the activities of antioxidants such as SOD, GSH, GST, and GPx in a variety of malignant disorders of various bodily organs46, 47.
The activity of hepatic GSH and SOD is frequently elevated in rats fed an HFD as a result of increased dietary cholesterol and triacylglycerols. Resveratrol has been found to protect against nicotine-induced lung damage by altering the degree of lipid peroxidation as well as boosting the antioxidant defense system by drastically reducing levels of ascorbic acid, vitamin E, GSH, GPx, and SOD23. The results, which examined the effects of RES-CMCS on lipid profile as well as liver antioxidant enzymes in hypolipidemic rats, found that an HFD weakened endogenous antioxidant defense systems. In addition to having a strong antiobesity impact, dietary RES-CMCS significantly reduced oxidative stress, as evidenced by the replenishment of depleted antioxidant molecules as well as decreased antioxidant enzyme activity.
One of our key findings was that RES-CMCS supplementation in obese rats induced significant changes in leptin and GLUT-4 expression in adipose tissue, implying that astaxanthin mediates its biological effects through at least one of these pathways.
Leptin plays an essential role in reducing TG build-up in the liver and skeletal muscle through direct activation of AMPK49, resulting in increased fatty acid oxidation. Leptin resistance, on the other hand, has been linked to a reduction in leptin-mediated JAK-STAT signaling and activation of SOCS350. As a result, the observed hypertriglyceridemia and hepatic steatosis caused by fructose in the current study could have been due to a decrease in hepatic fatty acid catabolism caused by leptin resistance. To our knowledge, the antiobesity effects of RES-CMCS in obese diabetic rats fed an HFD have not been previously documented.We have previously shown that resveratrol boosts GLUT4 protein expression in muscle from diabetic rats via a mechanism involving increased Slc2a4 gene expression. We hypothesized that this was connected to the impact of resveratrol on SIRT1, which was enhanced in muscle nuclei. Activation of SIRT1 by resveratrol is linked to the deacetylation of PPAR-G-coactivator 1 (PGC1)51, 52, which is also a powerful enhancer of Slc2a4 gene transcription53. Furthermore, deacetylation of the Slc2a4 gene promoter by SIRT1 cannot be ruled out; enhancer factor activity is also hampered. Together, these mechanisms may explain how resveratrol increases Slc2a4/GLUT4 expression via SIRT1.
Conclusion
In this investigation, we generated spherical resveratrol nanoparticles using low viscosity chitosan and assessed their characteristics by several methodologies. Furthermore, the current study showed that RES-CMCS had potent antiobesity and antioxidant effects in obese rats by modulating glucose, lipid profile, insulin, and oxidative stress indicators, as well as leptin and GLUT-4 gene expression. Overall, our findings suggested that RES-CMCS could be a promising novel antiobesity and antidiabetic therapy.
Abbreviations
GLUT-4: glucose transporter-4, GSH: reduced glutathione, HDL-C: HDL- cholesterol, PA: peak area, RES-CMCS: Resveratrol-carboxymethyl chitosan, Rt: retention time, RT-PCR: real-time PCR, SOD: superoxide dismutase, TBARS: thiobarbituric acid reactive substances, TC: total cholesterol, TG: Triglyceride
Acknowledgments
None.
Author’s contributions
All authors significantly contributed to this work, read and approved the final manuscript.
Funding
None.
Availability of data and materials
Supporting data, which includes spectroscopic and analytical data, will be made available to demonstrate the structure of the nanoparticles as well as their anti-obesity and antioxidant effects in vivo.
Ethics approval and consent to participate
Data collection was ethically approved by Research Ethics Committee of Faculty of Applied Medical Sciences, October 6 University in Egypt (No. 20210902). in- vivo lab studies formed the basis of this research, no human volunteers were used. Animal experiments were the only ones employed.
Consent for publication
The authors granted their permission for their personal information to be used in the article.
Competing interests
The authors declare that they have no competing interests.
References
-
M.A. Hussein,
Synthesis of some novel triazoloquinazolines and triazinoquinazolines and their evaluation for anti-inflammatory activity. Medicinal Chemistry Research.
2004;
21
(8)
:
1876-1886
.
View Article Google Scholar -
Barr
E.L.,
Zimmet
P.Z.,
Welborn
T.A.,
Jolley
D.,
Magliano
D.J.,
Dunstan
D.W.,
Risk of cardiovascular and all-cause mortality in individuals with diabetes mellitus, impaired fasting glucose, and impaired glucose tolerance: the Australian Diabetes, Obesity, and Lifestyle Study (AusDiab). Circulation.
2007;
116
(2)
:
151-7
.
View Article PubMed Google Scholar -
https://www.who.int/news-room/fact-sheets/detail/obesity-and-overweight. (Accessed on May 28, 2019)..
.
-
Abdel-Gawad
S.M.,
Ghorab
M.M.,
El-Sharief
A.M.,
El-Telbany
F.A.,
Abdel-Alla
M.,
Design, synthesis, and antimicrobial activity of some new pyrazolo[3,4-d] pyrimidines. Heteroatom Chemistry.
2003;
14
(6)
:
530-4
.
View Article Google Scholar -
Bailey
C.J.,
Biguanides and NIDDM. Diabetes Care.
1992;
15
(6)
:
755-72
.
View Article PubMed Google Scholar -
H.A. Abdel Maksoud,
M.G. Elharrif,
M.K. Mahfouz,
M.A. Omnia,
M.H. Abdullah,
M.E. Eltabey,
Biochemical study on occupational inhalation of benzene vapours in petrol station. Respir Med Case Rep.
2019;
27
:
100836
.
View Article PubMed Google Scholar -
Guerrero
R.F.,
García-Parrilla
M.C.,
Puertas
B.,
Cantos-Villar
E.,
Wine, resveratrol and health: a review. Natural Product Communications.
2009;
4
(5)
:
635-58
.
View Article PubMed Google Scholar -
Baur
J.A.,
Sinclair
D.A.,
Therapeutic potential of resveratrol: the in vivo evidence. Nature Reviews. Drug Discovery.
2006;
5
(6)
:
493-506
.
View Article PubMed Google Scholar -
Hussein
M.A.,
Prophylactic effect of resveratrol against ethinylestradiol-induced liver cholestasis. Journal of Medicinal Food.
2013;
16
(3)
:
246-54
.
View Article PubMed Google Scholar -
Zhong
Z.,
Froh
M.,
Lehnert
M.,
Schoonhoven
R.,
Yang
L.,
Lind
H.,
Polyphenols from Camellia sinenesis attenuate experimental cholestasis-induced liver fibrosis in rats. American Journal of Physiology. Gastrointestinal and Liver Physiology.
2003;
285
(5)
:
1004-13
.
View Article PubMed Google Scholar -
Ruotolo
R.,
Calani
L.,
Fietta
E.,
Brighenti
F.,
Crozier
A.,
Meda
C.,
Anti-estrogenic activity of a human resveratrol metabolite. Nutrition, Metabolism, and Cardiovascular Diseases.
2013;
23
(11)
:
1086-92
.
View Article PubMed Google Scholar -
R.M. Borik,
M.A. Hussein,
Synthesis, Molecular Docking, Biological Potentials and Structure Activity Relationship of New Quinazoline and Quinazoline-4-one Derivatives. Asian Journal of Chemistry.
2021;
33
(2)
:
423-438
.
View Article Google Scholar -
Guerrero
R.F.,
García-Parrilla
M.C.,
Puertas
B.,
Cantos-Villar
E.,
Wine, resveratrol and health: a review. Natural Product Communications.
2009;
4
(5)
:
635-58
.
View Article PubMed Google Scholar -
Hussein
M.A.,
El-Gizawy
H.A.,
Gobba
N.A.,
Mosaad
Y.O.,
Synthesis of Cinnamyl and caffeoyl derivatives of cucurbitacin-e-glycoside isolated from Citrullus colocynthis fruits and their structures antioxidant and anti-inflammatory activities relationship. Current Pharmaceutical Biotechnology.
2017;
18
(8)
:
677-93
.
View Article PubMed Google Scholar -
Ghorab
M.M.,
Ismail
Z.H.,
Abdalla
M.,
Synthesis and biological activities of some novel triazoloquinazolines and triazinoquinazolines containing benzenesulfonamide moieties. Arzneimittel-Forschung.
2010;
60
(2)
:
87-95
.
View Article PubMed Google Scholar -
Mohamad Shahi
M.,
Haidari
F.,
Shiri
M.R.,
Comparison of effect of resveratrol and vanadium on diabetes related dyslipidemia and hyperglycemia in streptozotocin induced diabetic rats. Advanced Pharmaceutical Bulletin.
2011;
1
(2)
:
81-6
.
PubMed Google Scholar -
Kreuter
J.,
Nanoparticles - a historical perspective. International Journal of Pharmaceutics.
2007;
331
(1)
:
1-10
.
View Article PubMed Google Scholar -
De Jong
W.H.,
Borm
P.J.,
Drug delivery and nanoparticles:applications and hazards. International Journal of Nanomedicine.
2008;
3
(2)
:
133-49
.
View Article PubMed Google Scholar -
Cho
K.,
Wang
X.,
Nie
S.,
Chen
Z.G.,
Shin
D.M.,
Therapeutic nanoparticles for drug delivery in cancer. Clinical Cancer Research.
2008;
14
(5)
:
1310-6
.
View Article PubMed Google Scholar -
Ibrahim
W.M.,
AlOmrani
A.H.,
Yassin
A.E.,
Novel sulpiride-loaded solid lipid nanoparticles with enhanced intestinal permeability. International Journal of Nanomedicine.
2014;
9
:
129-44
.
PubMed Google Scholar -
Martín
A.R.,
Villegas
I.,
Sánchez-Hidalgo
M.,
de la Lastra
C.A.,
The effects of resveratrol, a phytoalexin derived from red wines, on chronic inflammation induced in an experimentally induced colitis model. British Journal of Pharmacology.
2006;
147
(8)
:
873-85
.
View Article PubMed Google Scholar -
H.A. El Gizawy,
H.M. Abo-Salem,
A.A. Ali,
M.A. Hussein,
Phenolic Profiling and Therapeutic Potential of Certain Isolated Compounds from Parkia roxburghii against AChE Activity as well as GABAAα5, GSK-3β, and p38α MAP-Kinase Genes. ACS Omega.
2021;
6
(31)
:
2049220511
.
View Article Google Scholar -
Abou-Taleb
N.I.,
Elblasy
O.A.,
Elbesoumy
E.A.,
Basuny
H.I.,
Elhamadi
E.A.,
Nasr eldin MS, Emara AA, Ali AA, Salem MA, Ahmed FM, Hussein MA. Mechanism of Antiangiogenic and Antioxidant Activity of Newly Synthesized CAMBA in Ehrlich Ascites Carcinoma-Bearing Mice. Asian Journal of Chemistry.
2021;
33
(10)
:
2465-71
.
View Article Google Scholar -
Elgizawy
H.A.,
Ali
A.A.,
Hussein
M.A.,
Resveratrol: Isolation, and Its Nanostructured, Inhibits Cell Proliferation, Induces Cell Apoptosis in Certain Human Cell Lines Carcinoma and Exerts Protective Effect Against Paraquat-Induced Hepatotoxicity. Journal of Medicinal Food.
2020;
24
(1)
:
89-100
.
View Article PubMed Google Scholar -
Lee
A.,
Morley
J.E.,
Metformin decreases food consumption and induces weight loss in subjects with obesity with type II non-insulin-dependent diabetes. Obesity Research.
1998;
6
(1)
:
47-53
.
View Article PubMed Google Scholar -
Assinewe
V.A.,
Baum
B.R.,
Gagnon
D.,
Arnason
J.T.,
Phytochemistry of wild populations of Panax quinquefolius L. (North American ginseng). Journal of Agricultural and Food Chemistry.
2003;
51
(16)
:
4549-53
.
View Article PubMed Google Scholar -
Findlay
J.W.,
Dillard
R.F.,
Appropriate calibration curve fitting in ligand binding assays. The AAPS Journal.
2007;
9
(2)
:
260-7
.
View Article PubMed Google Scholar -
Fossati
P.,
Prencipe
L.,
Serum triglycerides determined colorimetrically with an enzyme that produces hydrogen peroxide. Clinical Chemistry.
1982;
28
(10)
:
2077-80
.
View Article PubMed Google Scholar -
Allain
C.C.,
Poon
L.S.,
Chan
C.S.,
Richmond
W.,
Fu
P.C.,
Enzymatic determination of total serum cholesterol. Clinical Chemistry.
1974;
20
(4)
:
470-5
.
View Article PubMed Google Scholar -
Burstein
M.,
Scholnick
H.R.,
Morfin
R.,
Rapid method for the isolation of lipoproteins from human serum by precipitation with polyanions. Journal of Lipid Research.
1970;
11
(6)
:
583-95
.
View Article PubMed Google Scholar -
Niehaus
W.G.,
Samuelsson
B.,
Formation of malonaldehyde from phospholipid arachidonate during microsomal lipid peroxidation. European Journal of Biochemistry.
1968;
6
(1)
:
126-30
.
View Article PubMed Google Scholar -
Ellman
G.L.,
Tissue sulfhydryl groups. Archives of Biochemistry and Biophysics.
1959;
82
(1)
:
70-7
.
View Article PubMed Google Scholar -
Kakkar
P.,
Das
B.,
Visvanathan
P.,
A modified spectrophotometric assay of SOD. Indian Journal of Biochemistry & Biophysics.
1984;
21
:
130-2
.
PubMed Google Scholar -
Feng
D.,
Ling
W.H.,
Duan
R.D.,
Lycopene suppresses LPS-induced NO and IL-6 production by inhibiting the activation of ERK, p38MAPK, and NF-kappaB in macrophages. Inflammation Research.
2010;
59
(2)
:
115-21
.
View Article PubMed Google Scholar -
Bancroft
G.D.,
Steven
A.,
Theory and Practice of Histological Technique. New York: Churchill Livingstone; 1983 .
Google Scholar -
Roa
M.,
Blane
K.,
Zonneberg
M.,
One way analysis of variance. Version IA (C). PC-STAT, Program coded by University of Georgia, USA, 1985. .
Google Scholar -
Zhong
Y.,
Chiou
Y.S.,
Pan
M.H.,
Shahidi
F.,
Anti-inflammatory activity of lipophilic epigallocatechin gallate (EGCG) derivatives in LPS-stimulated murine macrophages. Food Chemistry.
2012;
134
(2)
:
742-8
.
View Article PubMed Google Scholar -
de Pace
R.C.,
Liu
X.,
Sun
M.,
Nie
S.,
Zhang
J.,
Cai
Q.,
Anticancer activities of (-)-epigallocatechin-3-gallate encapsulated nanoliposomes in MCF7 breast cancer cells. Journal of Liposome Research.
2013;
23
(3)
:
187-96
.
View Article PubMed Google Scholar -
Barras
A.,
Mezzetti
A.,
Richard
A.,
Lazzaroni
S.,
Roux
S.,
Melnyk
P.,
Formulation and characterization of polyphenol-loaded lipid nanocapsules. International Journal of Pharmaceutics.
2009;
379
(2)
:
270-7
.
View Article PubMed Google Scholar -
Grenha
A.,
Seijo
B.,
Remuñán-López
C.,
Microencapsulated chitosan nanoparticles for lung protein delivery. European Journal of Pharmaceutical Sciences.
2005;
25
(4-5)
:
427-37
.
View Article PubMed Google Scholar -
S.A. Boshra,
M.A. Hussein,
Cranberry extract as a supplemented food in treatment of oxidative stress and breast cancer induced by N-Methyl-N-Nitrosourea in female virgin rats. International Journal of Phytomedicine.
2016;
8
(2)
:
217-227
.
-
Liang
L.,
Tajmir-Riahi
H.A.,
Subirade
M.,
Interaction of beta-lactoglobulin with resveratrol and its biological implications. Biomacromolecules.
2008;
9
(1)
:
50-6
.
View Article PubMed Google Scholar -
Zhang
J.,
Mi
Q.,
Shen
M.,
Resveratrol binding to collagen and its biological implication. Food Chemistry.
2012;
131
(3)
:
879-84
.
View Article Google Scholar -
Bray
G.A.,
Lovejoy
J.C.,
Smith
S.R.,
DeLany
J.P.,
Lefevre
M.,
Hwang
D.,
The influence of different fats and fatty acids on obesity, insulin resistance and inflammation. The Journal of Nutrition.
2002;
132
(9)
:
2488-91
.
View Article PubMed Google Scholar -
Estadella
D.,
Oyama
L.M.,
Dâmaso
A.R.,
Ribeiro
E.B.,
Oller Do Nascimento
C.M.,
Effect of palatable hyperlipidic diet on lipid metabolism of sedentary and exercised rats. Nutrition (Burbank, Los Angeles County, Calif.).
2004;
20
(2)
:
218-24
.
View Article PubMed Google Scholar -
R.M. Borik,
M.A. Hussein,
A Novel Quinazoline-4-one Derivatives as a Promising Cytokine Inhibitors: Synthesis, Molecular Docking, and Structure-activity Relationship. Curr Pharm Biotechnol.
2022;
23
(9)
:
1179-1203
.
View Article PubMed Google Scholar -
El Gizawy
H.A.,
Hussein
M.A.,
Abdel-Sattar
E.,
Biological activities, isolated compounds and HPLC profile of Verbascum nubicum. Pharmaceutical Biology.
2019;
57
(1)
:
485-97
.
View Article PubMed Google Scholar -
M.A. Hussein,
N.E.M. Ismail,
A.H. Mohamed,
R.M. Borik,
A.A. Ali,
Y.O. Mosaad,
Plasma Phospholipids: A Promising Simple Biochemical Parameter to Evaluate COVID-19 Infection Severity. Bioinform Biol Insights.
2021;
15
:
11779322211055891
.
View Article Google Scholar -
Minokoshi
Y.,
Kim
Y.B.,
Peroni
O.D.,
Fryer
L.G.,
Müller
C.,
Carling
D.,
Leptin stimulates fatty-acid oxidation by activating AMP-activated protein kinase. Nature.
2002;
415
(6869)
:
339-43
.
View Article PubMed Google Scholar -
H.A. El-Gizawy,
M.A. Hussein,
Fatty acids profile, nutritional values, anti-diabetic and antioxidant activity of the fixed oil of malvaparviflora growing in Egypt. International Journal of Phytomedicine.
2015;
7
:
219-230
.
-
Baur
J.A.,
Pearson
K.J.,
Price
N.L.,
Jamieson
H.A.,
Lerin
C.,
Kalra
A.,
Resveratrol improves health and survival of mice on a high-calorie diet. Nature.
2006;
444
(7117)
:
337-42
.
View Article PubMed Google Scholar -
Kitada
M.,
Koya
D.,
SIRT1 in Type 2 Diabetes: Mechanisms and Therapeutic Potential. Diabetes & Metabolism Journal.
2013;
37
(5)
:
315-25
.
View Article PubMed Google Scholar -
N.A.E.K. Gobba,
A. Hussein Ali,
D.E. El Sharawy,
M.A. Hussein,
The potential hazardous effect of exposure to iron dust in Egyptian smoking and nonsmoking welders. Arch Environ Occup Health.
2018;
73
(3)
:
189-202
.
View Article PubMed Google Scholar
Comments
Article Details
Volume & Issue : Vol 9 No 7 (2022)
Page No.: 5166-5178
Published on: 2022-07-31
Citations
Copyrights & License
This work is licensed under a Creative Commons Attribution 4.0 International License.
Search Panel
Pubmed
Google Scholar
Pubmed
Google Scholar
Pubmed
Google Scholar
Pubmed
Google Scholar
Pubmed
Search for this article in:
Google Scholar
Researchgate
- HTML viewed - 4997 times
- PDF downloaded - 1530 times
- XML downloaded - 0 times
