

Detection of COVID-19 Patients through SARS-CoV-2 Antigen Assay using Chemiluminescence Immunoassay: Comparison to RT-PCR Method
-
Truong Thien Phu

-
Tran Trong Tin
-
Le Phuong Mai
-
Tran Cong Tri
-
Vo Quoc Viet
-
Le Hoai Cuong
-
Nguyen Van Thanh
-
Ta Tuan Khanh
Copyrights: Truong Thien Phu, Tran Trong Tin, Le Phuong Mai, Tran Cong Tri, Vo Quoc Viet, Le Hoai Cuong, Nguyen Ngoc Truong, Nguyen Thi Nam Phuong, Nguyen Van Thanh, Ta Tuan Khanh, 2024. License: This work is licensed under a Creative Commons Attribution 4.0 International License.
Abstract
Background: Accurate and reliable diagnostic tools are essential in effectively managing infectious diseases during the ongoing global COVID-19 pandemic. For this study, the RT-PCR assay was used as the reference method, and the objective was to determine the concordance rate, sensitivity, and specificity of the SARS-CoV-2 antigen assay (SARS-CoV-2 Ag) using the chemiluminescence immunoassay (CLEIA) technique for identifying COVID-19 patients.
Method: A total of 231 nasopharyngeal swab samples were collected from individuals with either COVID-19 (cycle threshold (Ct) values ≤ 40) or non-COVID-19 (Ct values > 40 or undetected) diagnoses. These samples were examined using the SARS-CoV-2 Ag.
Results: The overall concordance rate of the SARS-CoV-2 Ag was 84.0% (194/231), with a sensitivity of 81.4% (162/199) and 100% specificity (32/32). When samples were categorized into two Ct value groups, the SARS-CoV-2 Ag demonstrated a sensitivity of 97.6% for samples with a Ct value ≤ 30 and 2.9% for samples with a Ct value > 30. Moreover, the antigen concentration determined by the SARS-CoV-2 Ag showed a strong inverse correlation with the Ct value obtained from the RT-PCR assay (r = -0.93, p < 0.001).
Conclusion: The SARS-CoV-2 Ag proves to be a potentially effective tool for diagnosing and monitoring COVID-19 patients, particularly in settings where the RT-PCR assay is not available.
Introduction
In December 2019, the World Health Organization (WHO) China Office first received reports of pneumonia cases with an unknown cause in Wuhan City, Hubei Province of China1. Following this, the Emergency Committee on the novel coronavirus (2019-nCoV) under the International Health Regulations (IHR 2005) reassembled on January 30, and ultimately, WHO declared the outbreak a public health emergency of global concern2. Fast forward to December 17, 2023, where over 772 million confirmed cases and 6.9 million deaths have been reported worldwide3. While global efforts have managed to temporarily stabilize the COVID-19 epidemic, the potential threat it poses remains, especially with emerging variants of SAR-CoV-2 that could complicate matters and cause the outbreak to resurface.
Diagnosing COVID-19 accurately can be particularly challenging due to its atypical symptoms. The method used to diagnose SARS-CoV-2 infections plays a crucial role in identifying cases and implementing necessary preventive measures4, 5. The gold standard for detecting SARS-CoV-2 infection remains the real-time reverse transcription Polymerase Chain Reaction (RT-PCR) test, which focuses on identifying the virus's RNA5. Despite its accuracy, RT-PCR has drawbacks such as extended turnaround times, specialized equipment needs, high testing costs, and resource-intensive processes, particularly in hospital settings6, 7, 8, 9. These limitations make it less feasible for implementation in smaller or medium-sized labs. Therefore, having a speedy and cost-effective method for screening COVID-19 cases is crucial to effectively combat outbreaks in various settings10.
Several manufacturers have developed rapid diagnostic kits for COVID-19 using Chromatographic Immunoassay (CIA) principles to detect antigens or antibodies for point-of-care testing. These SARS-CoV-2 kits have shown a sensitivity of 68.0% (95% CI, 59.0 – 76.0%) and specificity of 99.0% (95% CI, 99.0 – 100.0%)11. They offer simplicity, quick results, and the flexibility of being used without specific lab equipment or trained personnel. However, the CIA method's efficacy in SARS-CoV-2 Ag detection is particularly high in samples with substantial viral loads, making it most suitable for individuals within communities within five days of symptom onset11, 12. Despite its benefits, these kits provide only qualitative results, posing challenges in classifying COVID-19 patients based on their infection level post-screening.
A newer addition to the diagnostics field is the SARS-CoV-2 Ag assay by chemiluminescent enzyme immunoassay (CLEIA). This test detects the SARS-CoV-2 nucleocapsid protein (NP) antigen using multiple antibodies against the NP region in an automated system with quick results13. The CLEIA assay presents promise and offers an effective alternative in settings where the RT-PCR test may not be available for diagnosing COVID-19 patients. To comprehensively evaluate the performance of the SARS-CoV-2 Ag assay, our research compares it to the RT-PCR test as a reference method using nasopharyngeal swab samples for the routine diagnosis of SARS-CoV-2 infection.


| SARS-CoV-2 Ag | Positive samples (the RT-PCR assay) | |
| Ct ≤ 30 | Ct > 30 | |
| Positive | 161 | 1 |
| Negative | 4 | 33 |
| Total | 165 | 34 |
Methods
Study design and setting
This descriptive cross-sectional study was conducted at the Microbiology Department of Cho Ray Hospital from July 1, 2021, to November 30, 2021.
Sample collection and processing
Throughout our study period, all admitted patients were required to undergo COVID-19 testing upon Cho Ray Hospital visitation, regardless of symptom presentation, as per hospital protocol. All nasopharyngeal swab samples collected from individuals confirmed to have COVID-19 were placed in a 3 mL tube containing viral transport media (VTM). These samples were collected during either pre-admission screening or treatment at Cho Ray Hospital. Initially, all 231 samples underwent SARS-CoV-2 testing using the RT-PCR assay with the Alinity m SARS-CoV-2 Assay on the Alinity m automated system (Abbott, U.S.). The remaining samples were stored at 2-8°C and subsequently subjected to the SARS-CoV-2 Ag in the Lumipulse G1200 automated system within 24 hours, following the manufacturer's instructions.
The RT-PCR assay
First, the samples were treated for virus inactivation using Alinity m Lysis Solution (Abbott, U.S.) at a 1:1 ratio for 30 minutes (650 µL lysis solution + 650 µL sample). Then, the mixture was used to perform the RT-PCR assay with the Alinity m SARS-CoV-2 Assay kit on the Alinity m automated system (Abbott, U.S.). The cycle threshold (Ct) cut-off value for the RT-PCR assay was set at 40, distinguishing positive samples for SARS-CoV-2 (Ct ≤ 40) from negative samples (Ct > 40). Positive samples were further categorized into three groups based on viral load: high viral load (Ct < 25), moderate viral load (25 ≤ Ct ≤ 30), and low viral load (Ct > 30).
The SARS-CoV-2 antigen assay (SARS-CoV-2 Ag)
The concentration of SARS-CoV-2 antigen (Ag) was determined using Lumipulse® G SARS-CoV-2 Ag kit (Fujirebio, Japan). Following the RT-PCR assay, the residual sample would be treated with Sample Extraction Solution at a 1:1 ratio for 5 minutes (250 µL extraction solution + 250 µL sample). After centrifugation at 2000 g for 5 minutes, the supernatant was collected for performing the SARS-CoV-2 Ag in the Lumipulse G1200 automated system. Samples with an Ag concentration > 10.0 pg/mL were considered positive, samples with 1.0 – 10.0 pg/mL were labeled inconclusive, and a result of < 1.0 pg/mL was considered negative, following the manufacturer’s guidelines.
Statistical analysis
The results were analyzed using JASP Statistical Software version 0.16.4 (University of Amsterdam, Amsterdam, Netherlands) and Microsoft Excel 2016 (Microsoft Corporation, Redmond, Washington, USA). Sensitivity and specificity were calculated, excluding inconclusive results of the SARS-CoV-2 Ag. The correlation between the Ag concentration and Ct values determined by the RT-PCR assay was estimated using Pearson’s correlation coefficients.
Results
Comparison between the RT-PCR assay and the SARS-CoV-2 Ag
A total of 231 samples from 215 individuals (199 samples from 184 COVID-19 patients and 32 samples from 32 uninfected individuals) were first subjected to the RT-PCR assay, then the SARS-CoV-2 Ag test was performed within 24 hours (Figure 1 B).
Among the positive samples identified by the RT-PCR assay, 72.7% exhibited high viral loads (145/199), 10.1% showed moderate viral loads (20/199), and 17.2% had low viral loads (34/199), with a mean cycle threshold (Ct) of 21.21, ranging from 10.5 to 39.66 (Figure 1 A).
When using the RT-PCR assay as the reference, the cut-off for the antigen level was set to >10.0 pg/mL for positive and <1 pg/mL for negative, following the manufacturer’s guidelines. Excluding inconclusive results ranging from 1.0 to 10.0 pg/mL, the SARS-CoV-2 Ag showed an overall concordance rate of 84.0% (194/231), sensitivity of 81.4% (162/199), and specificity of 100% (32/32) (Figure 1 C).
In comparison with the RT-PCR assay in association with a Ct cut-off value of 30, the SARS-CoV-2 Ag was further assessed based on two Ct value groups included in the study. The results indicated that the test had a sensitivity of 97.6% (161/165) for samples with moderate and high viral loads (Ct ≤ 30) and a sensitivity of 2.9% (1/34) for samples with low viral loads (Ct > 30) (Table 1).
Correlations between Ag concentration and threshold cycle (Ct) values
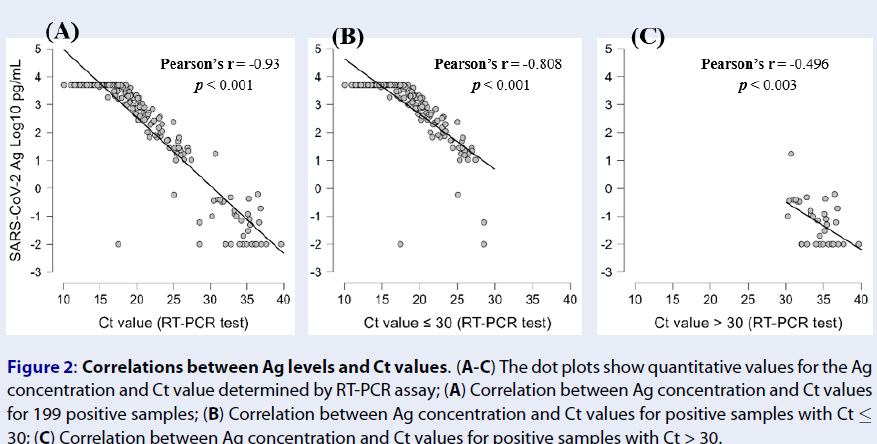
We then investigated the correlations between the Ag concentration and Ct values determined by the RT-PCR assay. Negative correlations were observed between the Ag concentration and Ct value (Pearson’s r = -0.93, p < 0.001) (Figure 2 A). This indicates that the higher the antigen concentration in the SARS-CoV-2 Ag, the lower the Ct value (and the higher the viral load) in the RT-PCR assay. For samples with Ct ≤ 30, a high correlation between the Ag concentration and Ct value was still recorded (Pearson’s r = -0.808, p < 0.001) (Figure 2 B), while this correlation was at a medium level for samples with Ct > 30 (Pearson’s r = -0.496, p < 0.003) (Figure 2 C). These results demonstrated that the Ag concentration reflects the viral load with significant predictive value.
Discussion
In this study, we assessed the performance of the SARS-CoV-2 Ag test in detecting the presence of the virus in nasopharyngeal and pharyngeal swab samples, using RT-PCR as the reference method. Our results demonstrated that the SARS-CoV-2 Ag test had a sensitivity of 81.4%, a specificity of 100%, and an overall concordance rate of 84.0%. These findings are consistent with a study by Yosuke Hirotsu et al. in Japan (2021) that reported sensitivity, specificity, and overall concordance rates of 84.8%, 97.9%, and 88.3%, respectively14. However, our study showed lower sensitivity and overall concordance rates compared to the manufacturer's stated clinical efficacy evaluation results of 91.7% sensitivity, 98.5% specificity, and 98.2% accuracy. This variance could be due to differences in sample size and the criteria used for result interpretation13. Notably, most false-negative samples in our study (90%) came from individuals with low viral loads (33 out of 37). This trend of reduced sensitivity in samples with low viral loads has also been observed in other studies15. Our initial findings suggest that while the SARS-CoV-2 Ag test has excellent specificity (100%), its sensitivity and accuracy are relatively high, meeting the minimum performance standards set by the World Health Organization16.
The SARS-CoV-2 Ag test performs well in samples with medium to high viral loads, with a sensitivity of 97.7%, making it effective in identifying symptomatic patients with evident viral shedding. However, its accuracy drops significantly in samples with low viral loads, leading to a high false-negative rate of up to 97.1%. This indicates that the SARS-CoV-2 Ag test is suitable for detecting infections in patients with medium to high viral loads but may not be as reliable for asymptomatic individuals, often having a Ct value over 30. In such instances, the RT-PCR assay remains essential. The RT-PCR method is known for its sensitivity in detecting even trace amounts of viral RNA, useful for identifying viral shedding during various stages of infection and recovery5. Positive RT-PCR results with Ct values over 30 may indicate a low viral load, potentially less infectious or representing residual viral fragments post-recovery14, 17, 18. A comprehensive approach, integrating clinical symptoms, epidemiological data, and laboratory findings, is crucial for accurately assessing infection risk.
Implementing the RT-PCR assay in small and medium-sized labs presents challenges due to equipment costs, maintenance, and limited sample processing capacities. In these settings, the SARS-CoV-2 Ag test emerges as a viable alternative, especially in primary healthcare labs or border locations facing logistical difficulties in sending samples to centralized labs. Notably, compared to immunochromatographic methods, the SARS-CoV-2 Ag test provides quantitative results, aiding clinicians in patient monitoring and risk assessment. The strong correlation between Ag concentration and Ct values determined by RT-PCR offers a reliable basis for predicting viral load. While the SARS-CoV-2 Ag test offers benefits like cost-effectiveness, quick results, and automation, its reduced sensitivity compared to RT-PCR may miss early-stage cases with low virus levels. Conversely, RT-PCR excels in detecting these cases, particularly those with Ct values exceeding 30.
Limitations of this study include the sample size, particularly for cases with Ct ≥ 25, which may limit a comprehensive evaluation of viral load levels. Additionally, the study lacks data on symptom onset and resolution, hindering a thorough examination of how these factors impact Ag concentration and Ct values determined by RT-PCR.
Conclusions
In conclusion, the SARS-CoV-2 Ag using CLEIA combines the precision of the RT-PCR method with the rapidity of the Chromatographic Immunoassay (CIA) method. Its hands-on instrument operation simplicity reduces the risk of errors in laboratory procedures, optimizes resources and operating costs, and minimizes training time for new employees. The SARS-CoV-2 Ag with CLEIA can be an effective approach for diagnosing and monitoring COVID-19 patients, offering high accuracy in its results.
Overall, the SARS-CoV-2 Ag using CLEIA provides a reliable and efficient option for healthcare professionals to quickly and accurately diagnose COVID-19. Its ease of use and accuracy make it a valuable tool in battling the pandemic.
Abbreviations
Ct: Cycle Threshold, CIA: Chromatographic Immunoassay, CLEIA: Chemiluminescence Immunoassay, COVID-19: Coronavirus Disease 2019, NP: Nucleocapsid Protein, RT-PCR: Real-Time Reverse Transcription Polymerase Chain Reaction, SARS-CoV-2: Severe Acute Respiratory Syndrome Coronavirus 2, VTM: Viral Transport Media, WHO: World Health Organization
Acknowledgments
None.
Author’s contributions
Conceptualization: Truong Thien Phu and Tran Trong Tin; Acquisition of data: Truong Thien Phu, Tran Cong Tri, Ta Tuan Khanh, Le Hoai Cuong, Nguyen Ngoc Truong, Nguyen Thi Nam Phuong, and Nguyen Van Thanh; Validation data: Truong Thien Phu and Tran Trong Tin; Formal analysis: Truong Thien Phu, Tran Trong Tin, Vo Quoc Viet, and Le Phuong Mai; Writing - original draft: Tran Trong Tin and Le Phuong Mai; Writing - review and editing: Truong Thien Phu. All authors have read and agreed to the published version of the manuscript.
Funding
None.
Availability of data and materials
Data and materials used and/or analyzed during the current study are available from the corresponding author on reasonable request.
Ethics approval and consent to participate
Cho Ray Hospital Ethics Committee (Ho Chi Minh, Vietnam) approved the study (reference number 1401/GCN-HĐĐĐ). The study complies with the principles of the 1964 Helsinki Declaration and its later amendments. The requirement for written informed consent was waived.
Consent for publication
Not applicable.
Competing interests
The authors declare that they have no competing interests.
References
-
World Health Organization (WHO). Novel Coronavirus (2019-nCoV) Situation Report – 1. Geneva, Switzerland; 2020..
.
-
World Health Organization (WHO). Novel Coronavirus (2019-nCoV) Situation Report – 11. Geneva, Switzerland; 2020.
.
-
World Health Organization (WHO). Weekly epidemiological update on COVID-19 - 23 November 2022. Geneva, Switzerland; 2022.
.
-
Guan
W.J.,
Ni
Z.Y.,
Hu
Y.,
Liang
W.H.,
Ou
C.Q.,
He
J.X.,
Clinical Characteristics of Coronavirus Disease 2019 in China. N Engl J Med [Internet]. 2020 Apr 30 PMC7092819]; 382(18):[1708-20 pp.]. Available from: https://www.ncbi.nlm.nih.gov/pubmed/32109013. New England journal of medicine..
2020;
382
(18)
:
1708--1720
.
View Article Google Scholar -
Udugama
B.,
Kadhiresan
P.,
Kozlowski
H.N.,
Malekjahani
A.,
Osborne
M.,
Li
V.Y.,
Diagnosing COVID-19: The Disease and Tools for Detection. ACS nano.
2020;
14
(4)
:
3822-3835
.
View Article Google Scholar -
Archetti
C.,
Montanelli
A.,
Finazzi
D.,
Caimi
L.,
Garrafa
E.,
Clinical Laboratory Automation: A Case Study. Journal of public health research.
2017;
6
(1)
:
jphr-2017
.
View Article Google Scholar -
Feng
W.,
Newbigging
A.M.,
Le
C.,
Pang
B.,
Peng
H.,
Cao
Y.,
Molecular Diagnosis of COVID-19: Challenges and Research Needs. Analytical Chemistry.
2022;
92
(15)
:
10196-209
.
View Article Google Scholar -
Mitchell
S.L.,
St George
K.,
Rhoads
D.D.,
Butler-Wu
S.M.,
Dharmarha
V.,
McNult
P.,
. 2020
.
-
Perchetti
G.A.,
Pepper
G.,
Shrestha
L.,
LaTurner
K.,
Kim
D. Yae,
Huang
M.L.,
Performance characteristics of the Abbott Alinity m SARS-CoV-2 assay. Journal of Clinical Virology.
2021;
140
:
104869
.
View Article Google Scholar -
Yokota
I.,
Shane
P.Y.,
Okada
K.,
Unoki
Y.,
Yang
Y.,
Iwasaki
S.,
A novel strategy for SARS-CoV-2 mass screening with quantitative antigen testing of saliva: a diagnostic accuracy study. The Lancet Microbe.
2021;
2
(8)
:
e397-404
.
View Article Google Scholar -
Lee
J.,
Song
J.U.,
Shim
S.R.,
Comparing the diagnostic accuracy of rapid antigen detection tests to real time polymerase chain reaction in the diagnosis of SARS-CoV-2 infection: A systematic review and meta-analysis. Journal of Clinical Virology.
2021;
144
:
104985
.
View Article Google Scholar -
Chaimayo
C.,
Kaewnaphan
B.,
Tanlieng
N.,
Athipanyasilp
N.,
Sirijatuphat
R.,
Chayakulkeeree
M.,
Rapid SARS-CoV-2 antigen detection assay in comparison with real-time RT-PCR assay for laboratory diagnosis of COVID-19 in Thailand. Virology journal.
2020;
17
:
177
.
View Article Google Scholar -
Fujirebio. Lumipulse G SARS-CoV-2 Ag Immunoreaction Cartridges. 2021
.
-
Hirotsu
Y.,
Sugiura
H.,
Maejima
M.,
Hayakawa
M.,
Mochizuki
H.,
Tsutsui
T.,
Comparison of Roche and Lumipulse quantitative SARS-CoV-2 antigen test performance using automated systems for the diagnosis of COVID-19. International Journal of Infectious Diseases.
2021;
108
:
263-9
.
View Article PubMed Google Scholar -
Menchinelli
G.,
Bordi
L.,
Liotti
F.M.,
Palucci
I.,
Capobianchi
M.R.,
Sberna
G.,
Lumipulse G SARS-CoV-2 Ag assay evaluation using clinical samples from different testing groups. Clinical Chemistry and Laboratory Medicine.
2021;
59
(8)
:
1468-1476
.
View Article Google Scholar -
World Health Organization (WHO). Technical Specifications For Selection Of Essential In Vitro Diagnostics For Sars-Cov-2: WHO; 2021 [Available from: https://www.who.int/publications/m/item/technical-specifications-for-selection-of-essential-in-vitro-diagnostics-for-sars-cov-2..
.
-
Tom
M.R.,
Mina
M.J.,
To Interpret the SARS-CoV-2 Test, Consider the Cycle Threshold Value. Clinical Infectious Diseases.
2020;
71
(16)
:
2252-4
.
View Article PubMed Google Scholar -
Wölfel
R.,
Corman
V.M.,
Guggemos
W.,
Seilmaier
M.,
Zange
S.,
Müller
M.A.,
Virological assessment of hospitalized patients with COVID-2019. Nature.
2020;
581
(7809)
:
465-9
.
View Article PubMed Google Scholar
Comments
Article Details
Volume & Issue : Vol 11 No 4 (2024)
Page No.: 6333-6338
Published on: 2024-04-30
Citations
Copyrights & License
This work is licensed under a Creative Commons Attribution 4.0 International License.
Search Panel
- HTML viewed - 2436 times
- PDF downloaded - 1084 times
- XML downloaded - 71 times
